Master Water Resources Engineering, Cum Laude
Katholieke Universiteit Leuven (KU Leuven) - Vrije Universiteit Brussel (VUB) · VLIR-UOS Scholarship
Thesis
Blue and Green Water Analysis with Temporal LULC Classification — Rocha Basin, Cochabamba
Trained and validated a Random Forest land-cover classification model in Google Earth Engine using Landsat time series (2000, 2016, 2025), and calibrated and validated a SWAT+ hydrological model with observed streamflow to isolate the impact of land-use change on the basin's blue and green water components.
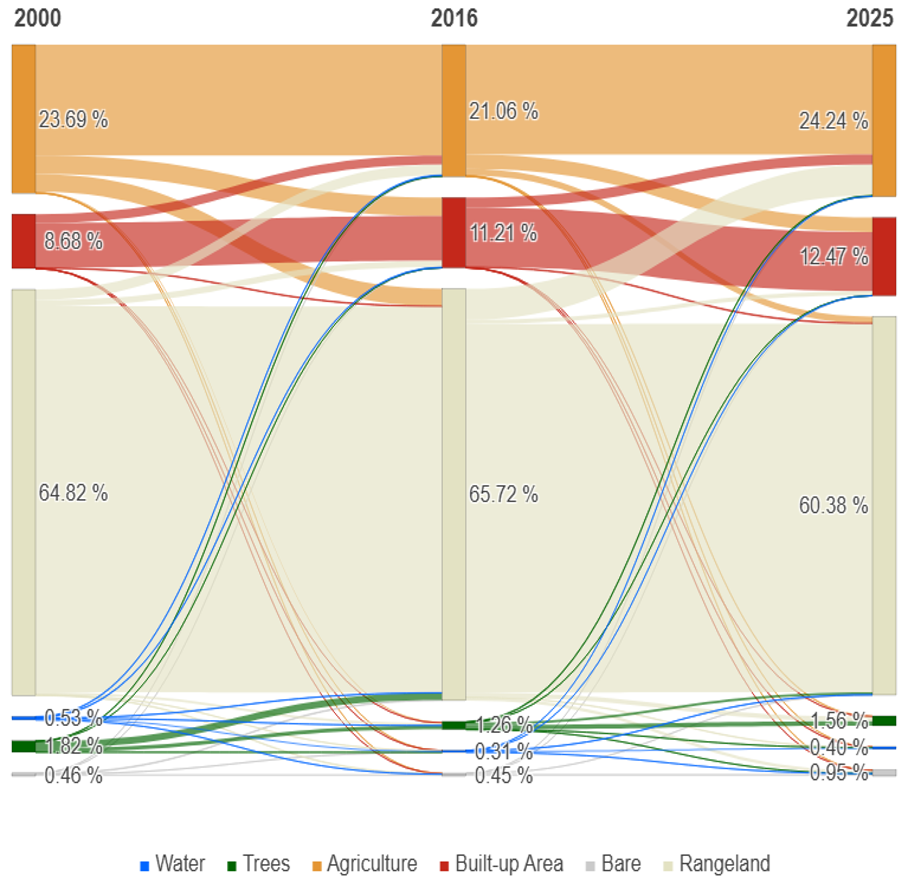
Sankey diagram from the Random Forest classification, showing agriculture and built-up area both expanding at the expense of rangeland.
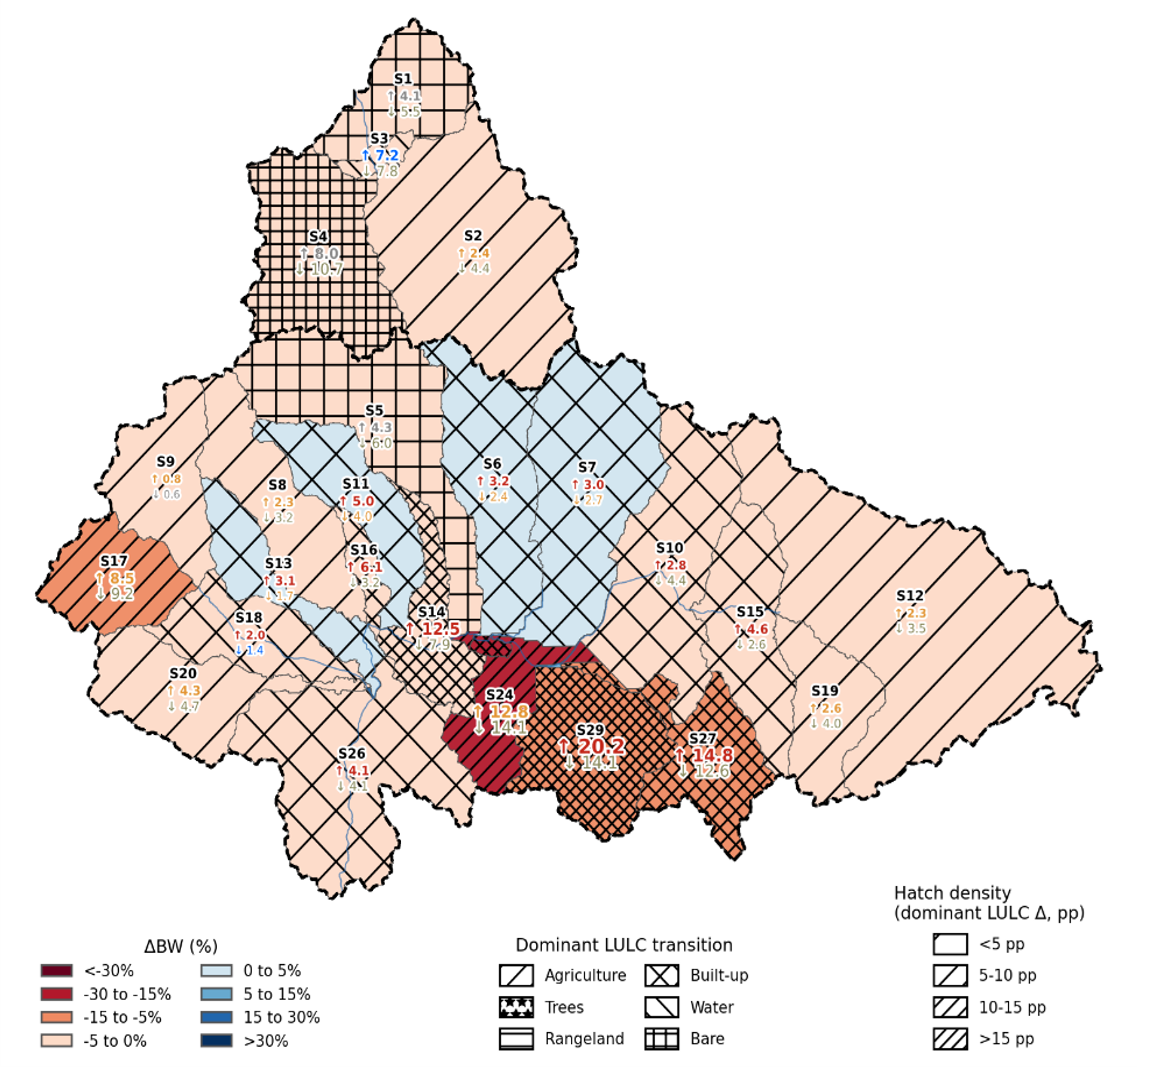
Color shows the magnitude of change; hatching shows each sub-basin's dominant LULC transition, linking hydrological impact to its land-use driver.
Main Courses
Earth Observation & Remote Sensing
Microwave remote sensing (Sentinel-1 SAR + SMAP): analyzed VV/VH backscatter and the cross-polarization ratio as a vegetation proxy; compared Sentinel-1's high spatial resolution against SMAP's coarser but physically direct soil moisture retrievals. Detected agricultural drought years (2016-2020) in Belgium using a percentile-based anomaly threshold with a persistence criterion, and critically assessed the limitations of soil-moisture-based flood detection.
Optical remote sensing (Sentinel-2 + Google Earth Engine): computed NDVI, NDWI and NBR spectral indices; performed unsupervised (K-means) and supervised (Random Forest) land-cover classification, comparing atmospherically corrected (L2A) against uncorrected (L1C) imagery. Evaluated classification accuracy using a confusion matrix, producer's/user's accuracy, and errors of omission/commission.
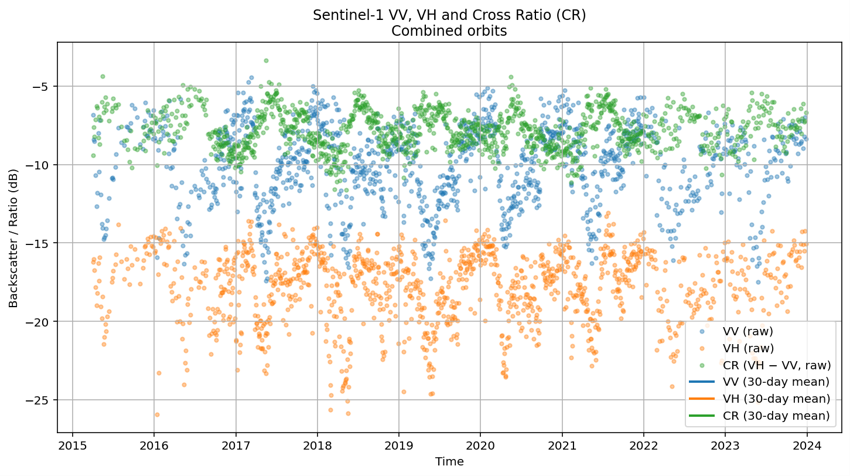
30-day moving averages over 9 years of backscatter data.
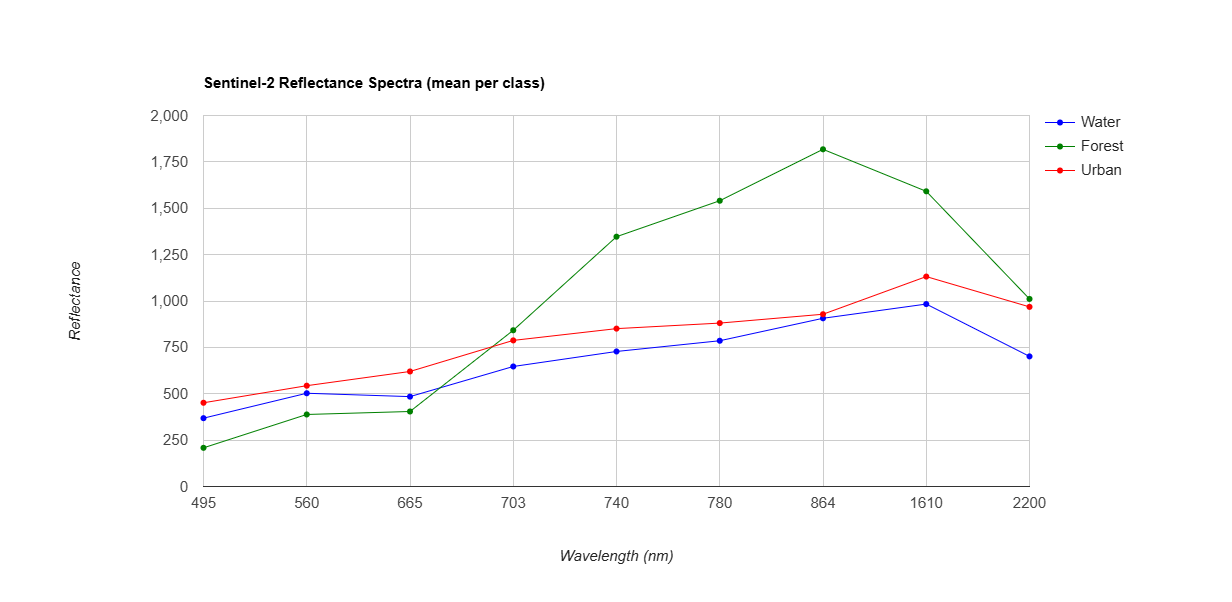
Atmospheric correction reduces overestimated reflectance and improves spectral separability.
Environmental Programming
As a group project, we analyzed global burned area simulations (CLASSIC land-surface model, 1901-2019) using Python's scientific NetCDF stack (iris, xarray, regionmask). We masked data by IPCC AR6 climate regions, computed area-weighted burnt area accounting for grid cell curvature, and aggregated results into monthly, cumulative and annual time series per region. We produced a global map of peak fire-season timing per pixel, revealing expected seasonal patterns — for example, boreal regions peaking in summer and opposite-hemisphere fire seasons driven by regional dry periods.
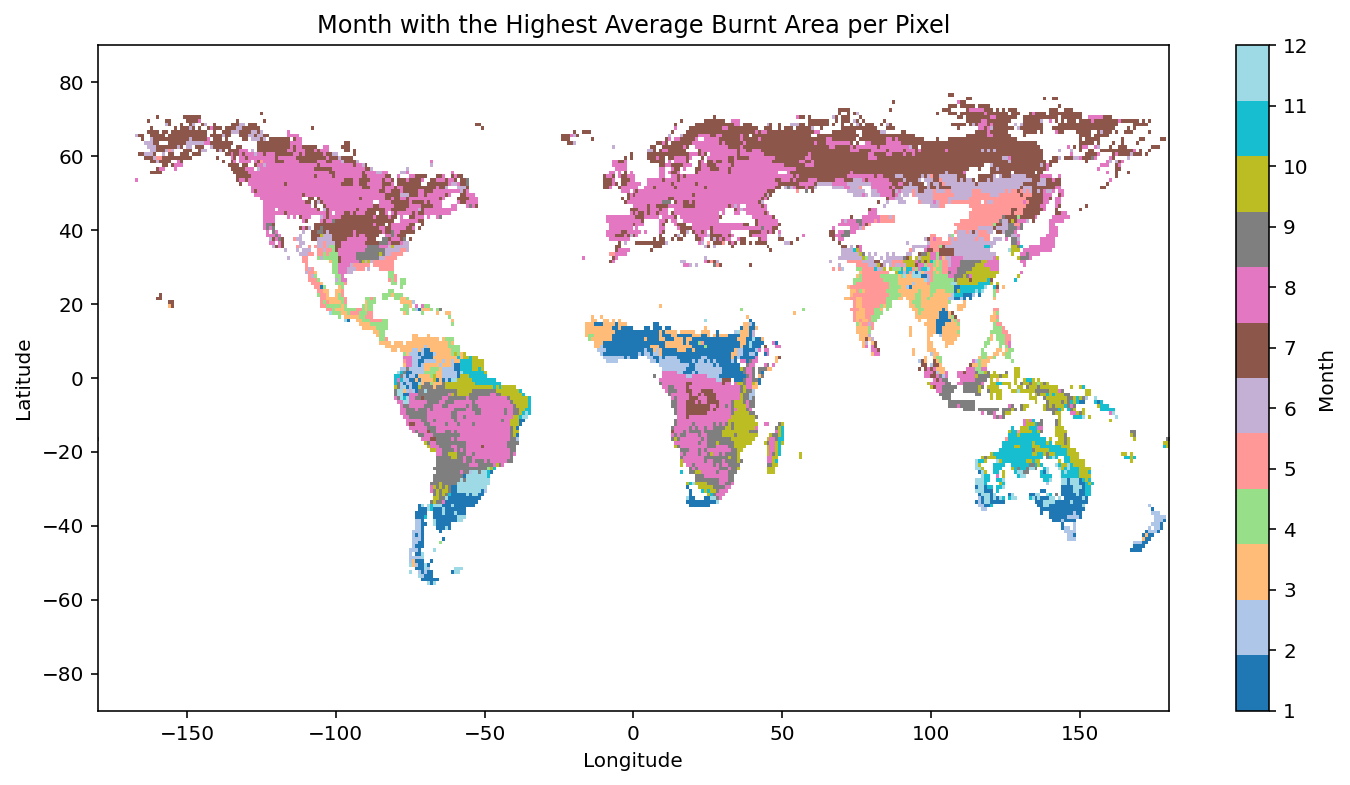
Boreal regions peak in July; opposite-hemisphere fire seasons reflect regional dry periods.
GIS for Environmental Applications
Built an integrated hazard-vulnerability-risk assessment for Colombia in QGIS using map algebra. Combined eight hazard layers (seismic, volcanic, tsunami, flooding, landslide, river, coastal, topography) into a weighted hazard raster using conditional raster calculator expressions, and four vulnerability layers (population density, industry, infrastructure, economic concentration) into a vulnerability raster — including calculating population density by department from vector data. Derived a final risk map using a two-dimensional decision matrix combining hazard and vulnerability classes, then produced a climate-change scenario by adjusting hazard weights (coastal erosion +150%, flooding +100%, landslides +50%) based on published climate projections for Colombia.
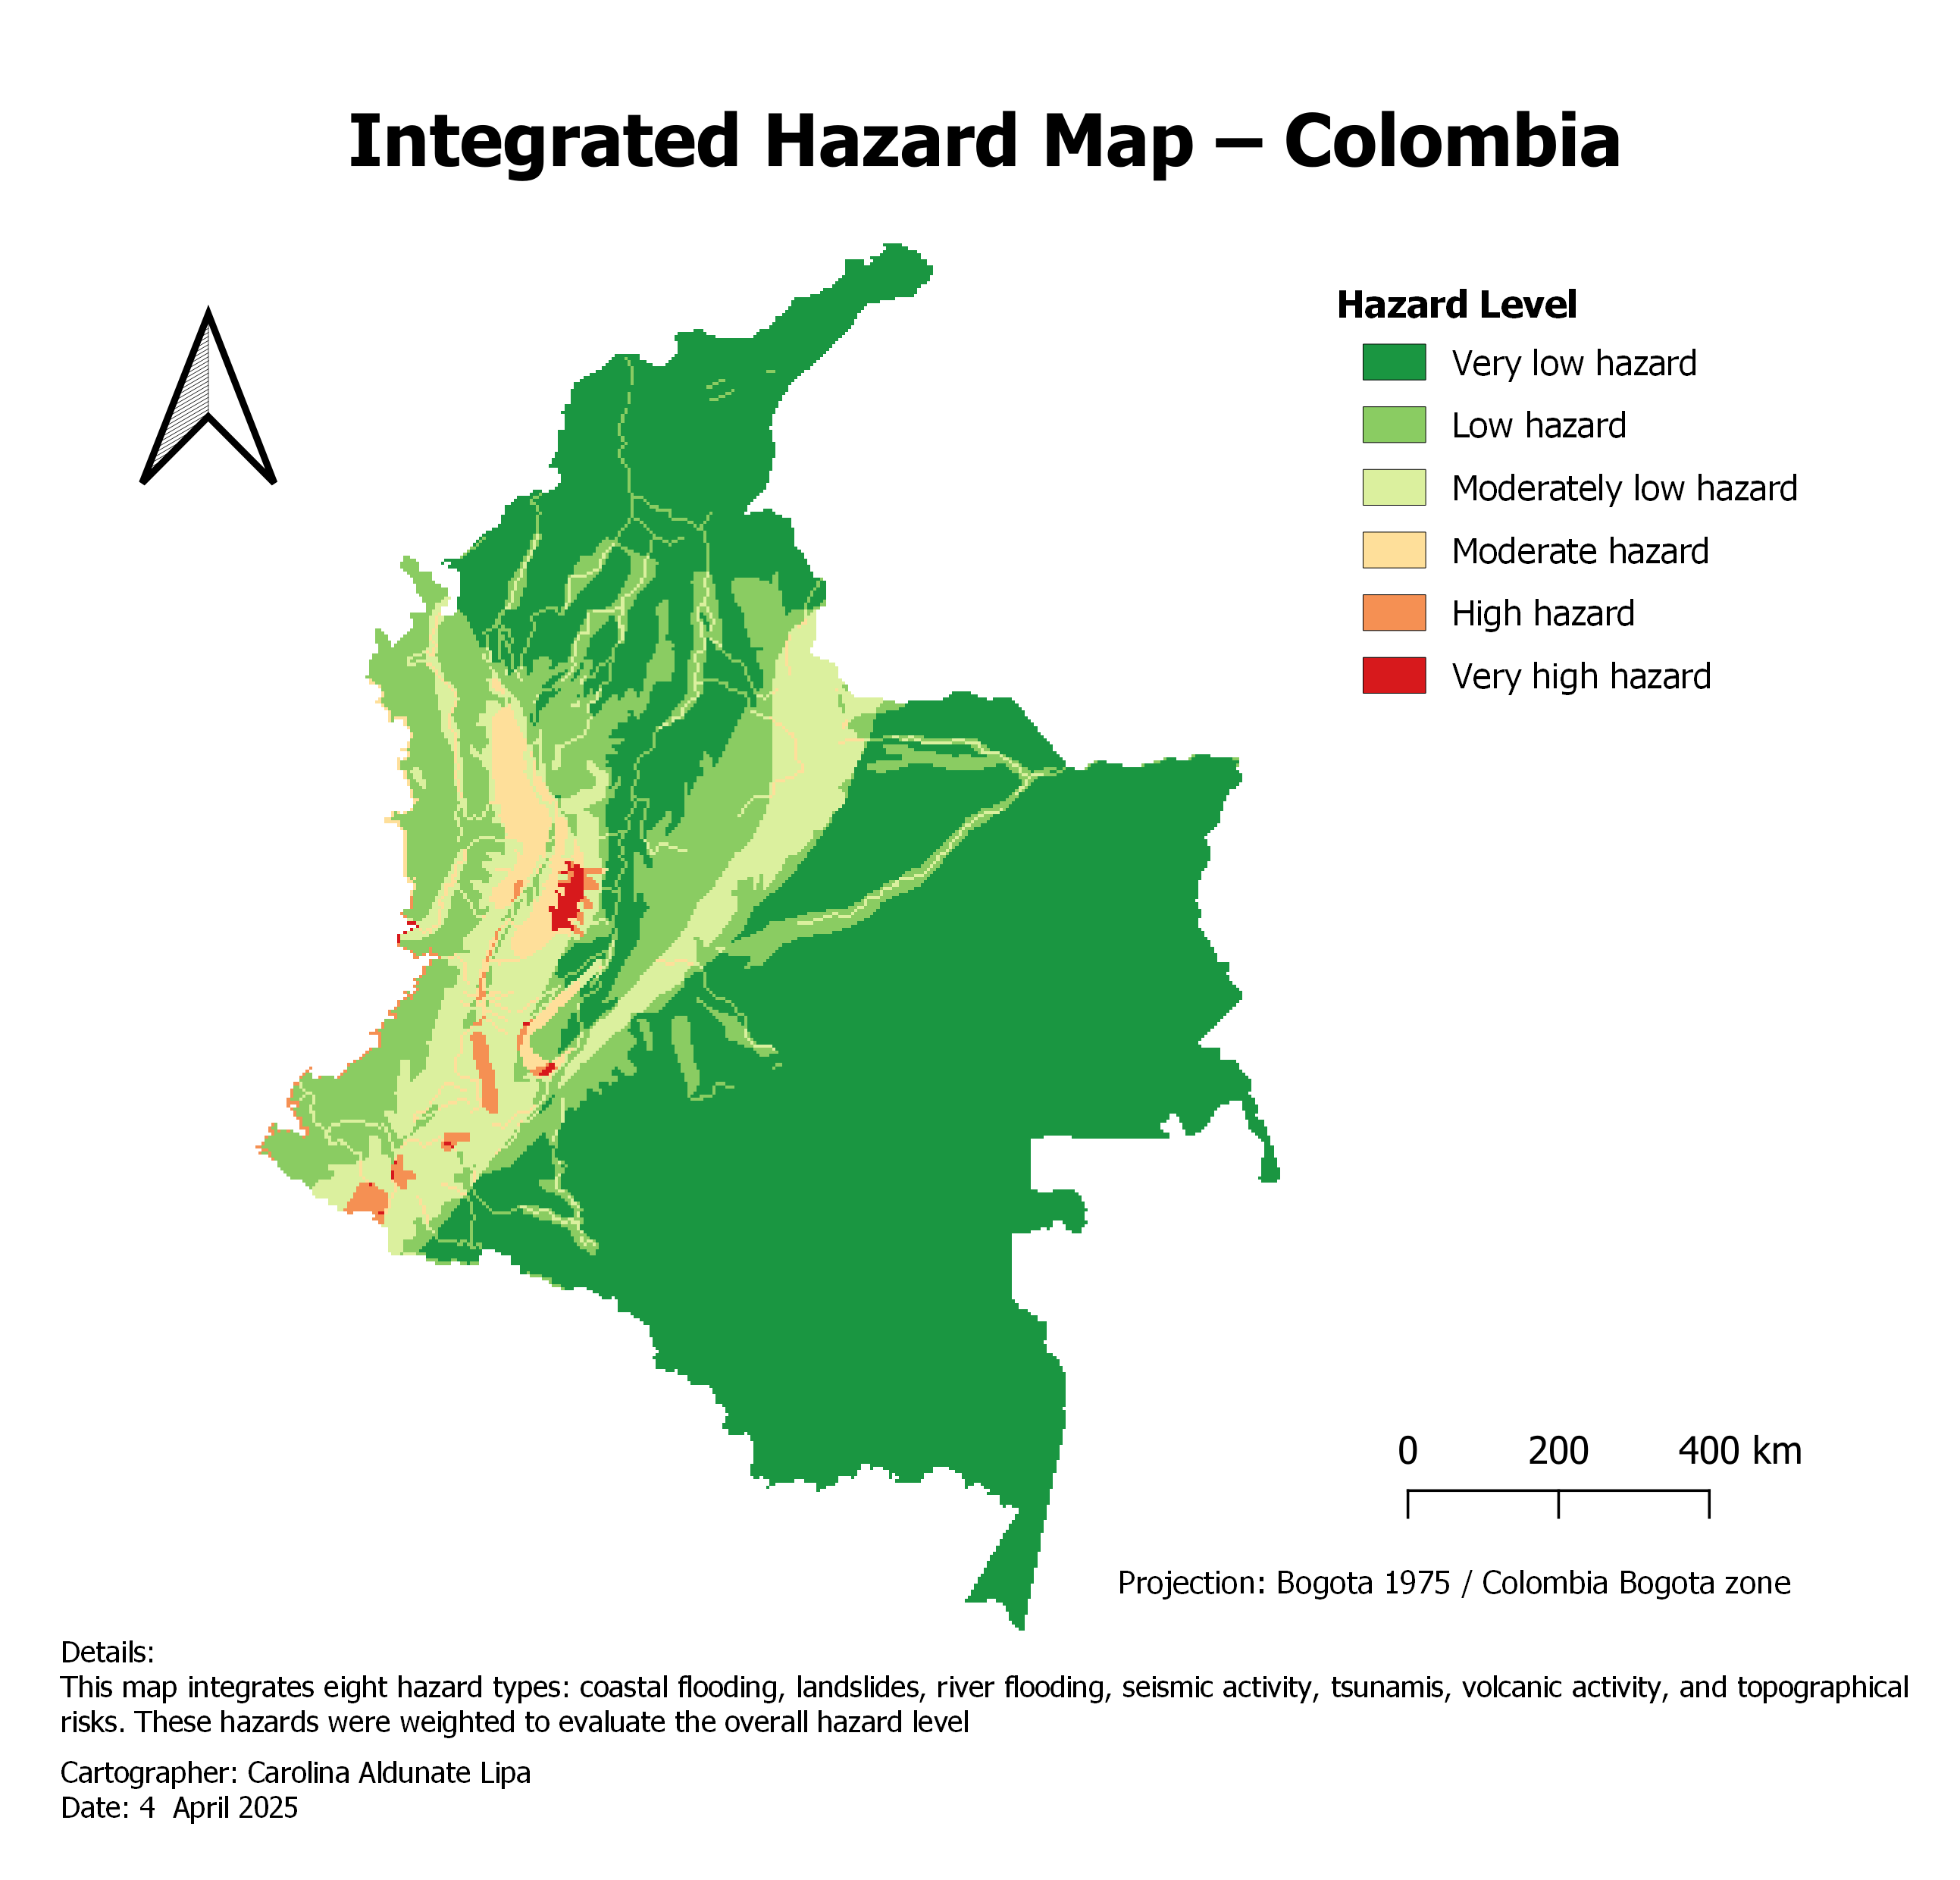
Combines eight weighted hazard layers using raster calculator map algebra in QGIS.
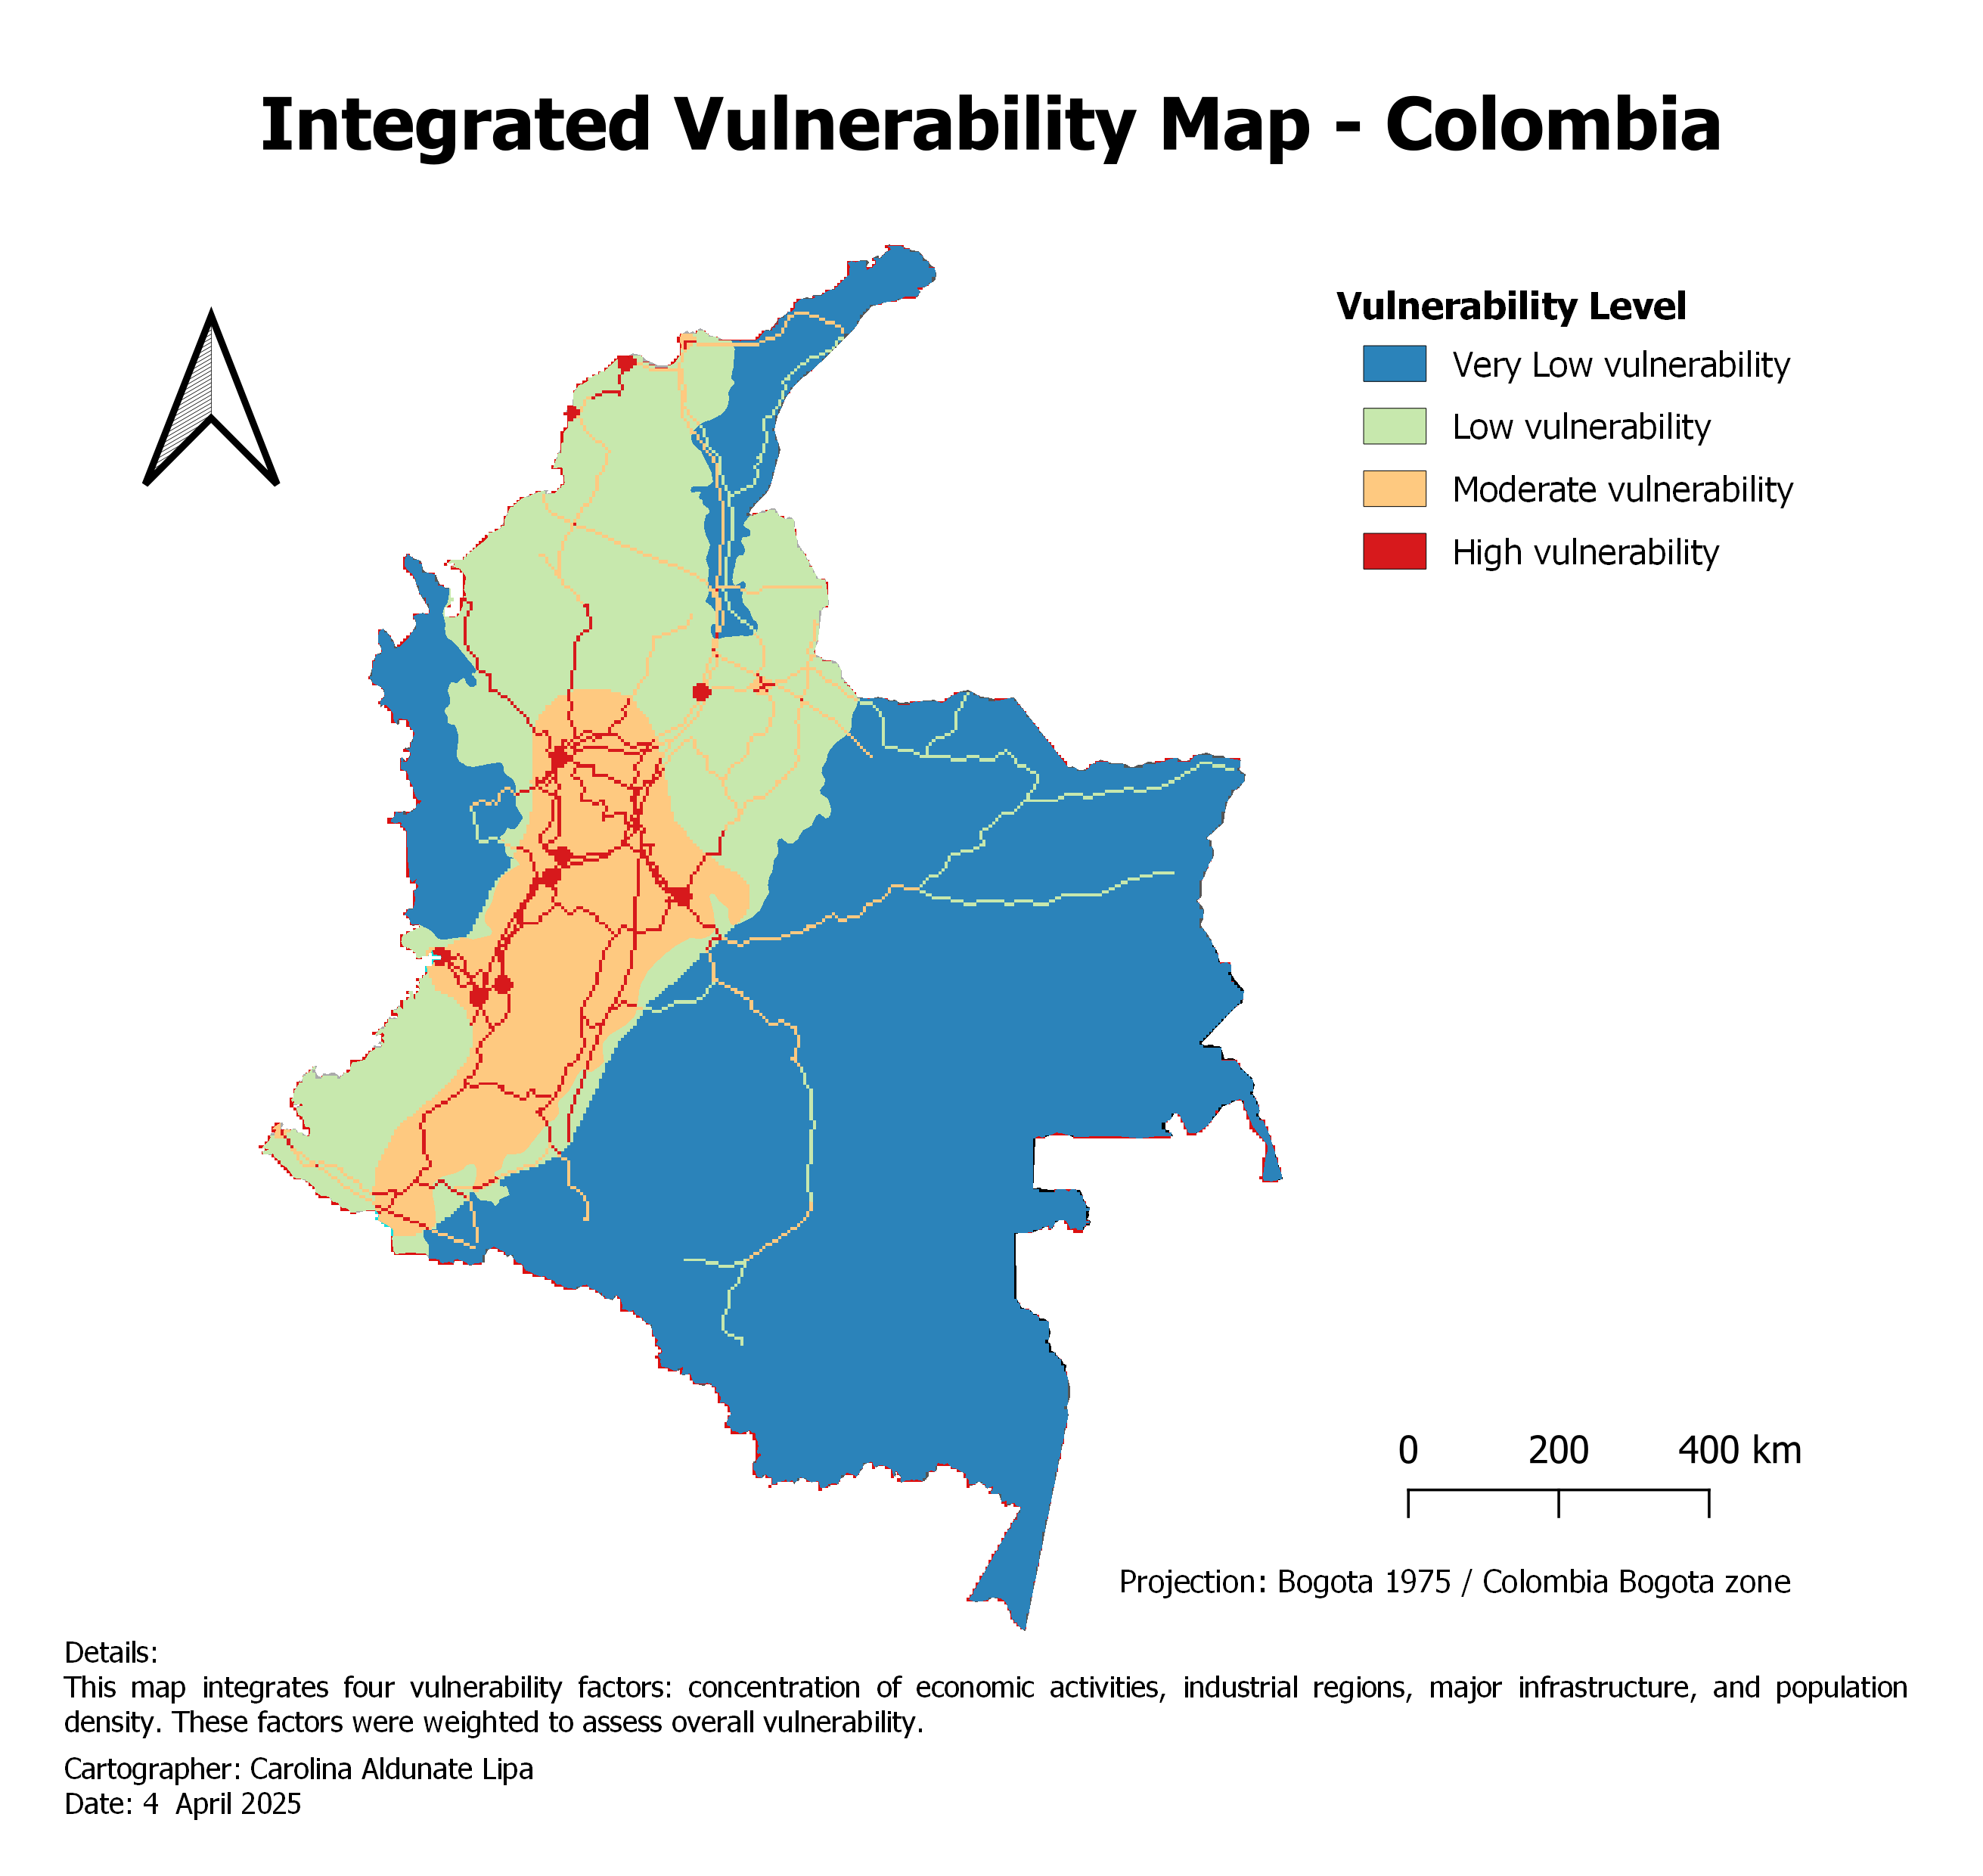
Combines population density, industry, infrastructure and economic concentration.
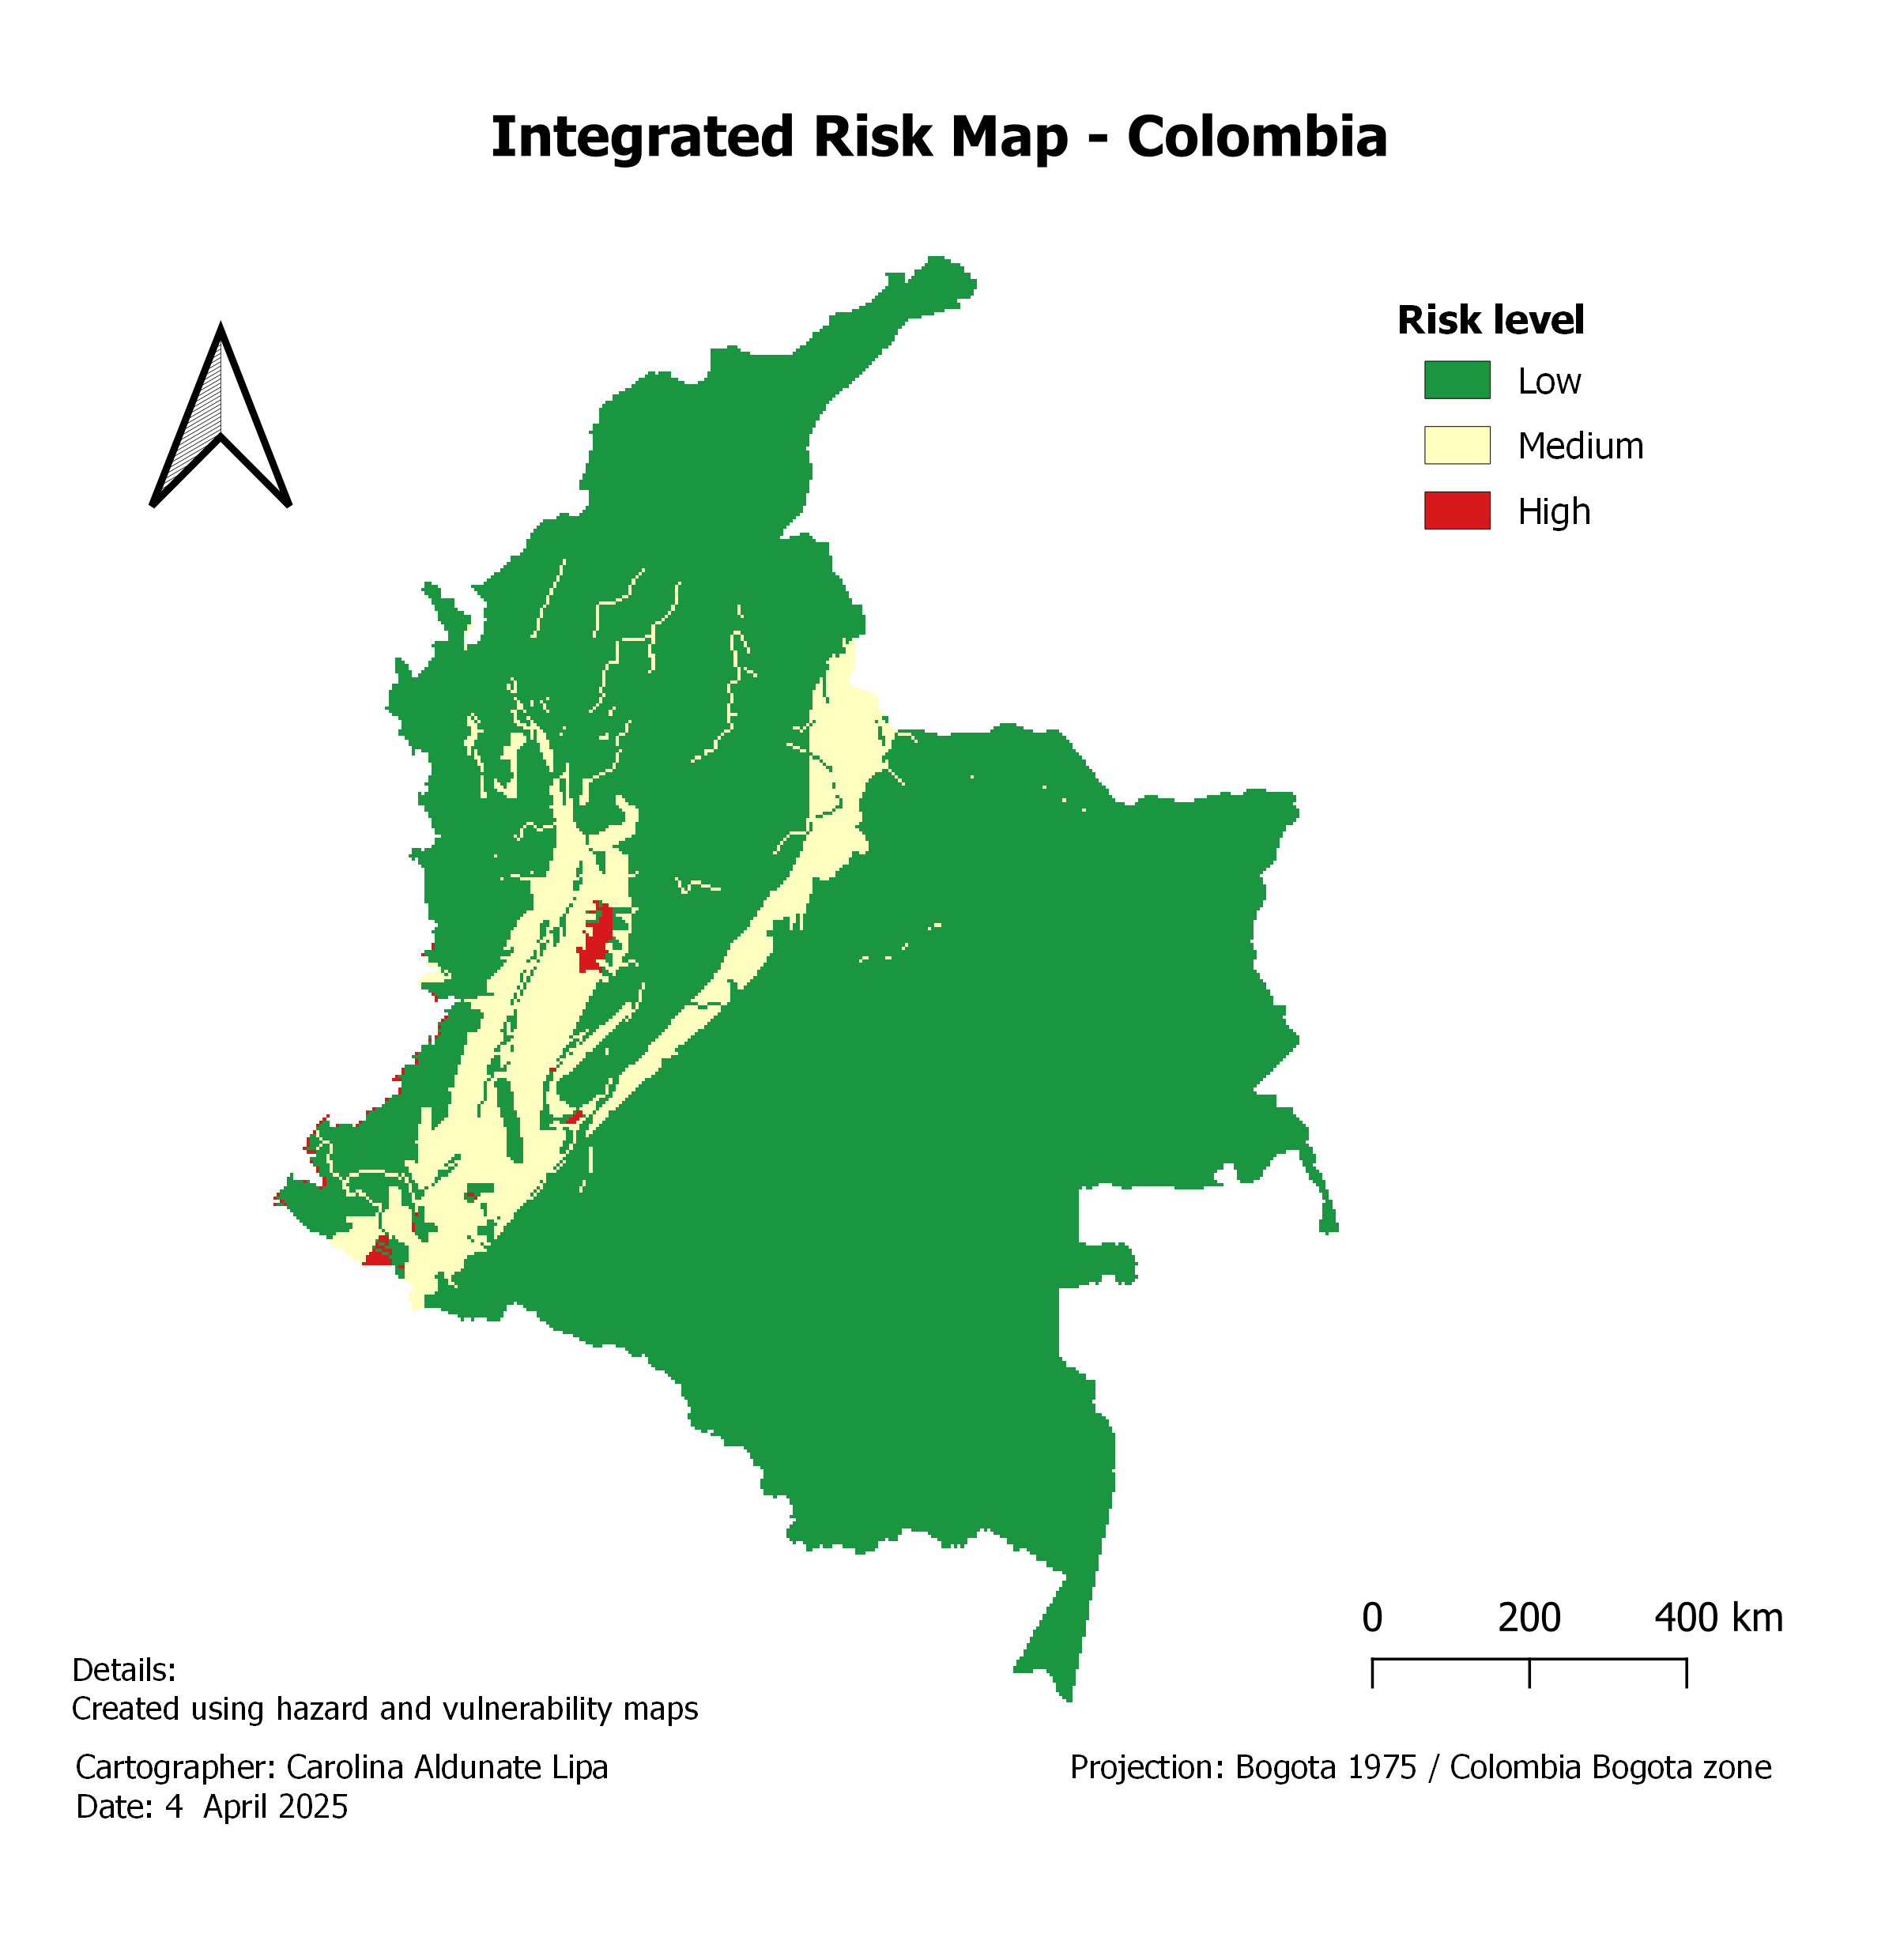
Derived from hazard × vulnerability using a two-dimensional decision matrix.
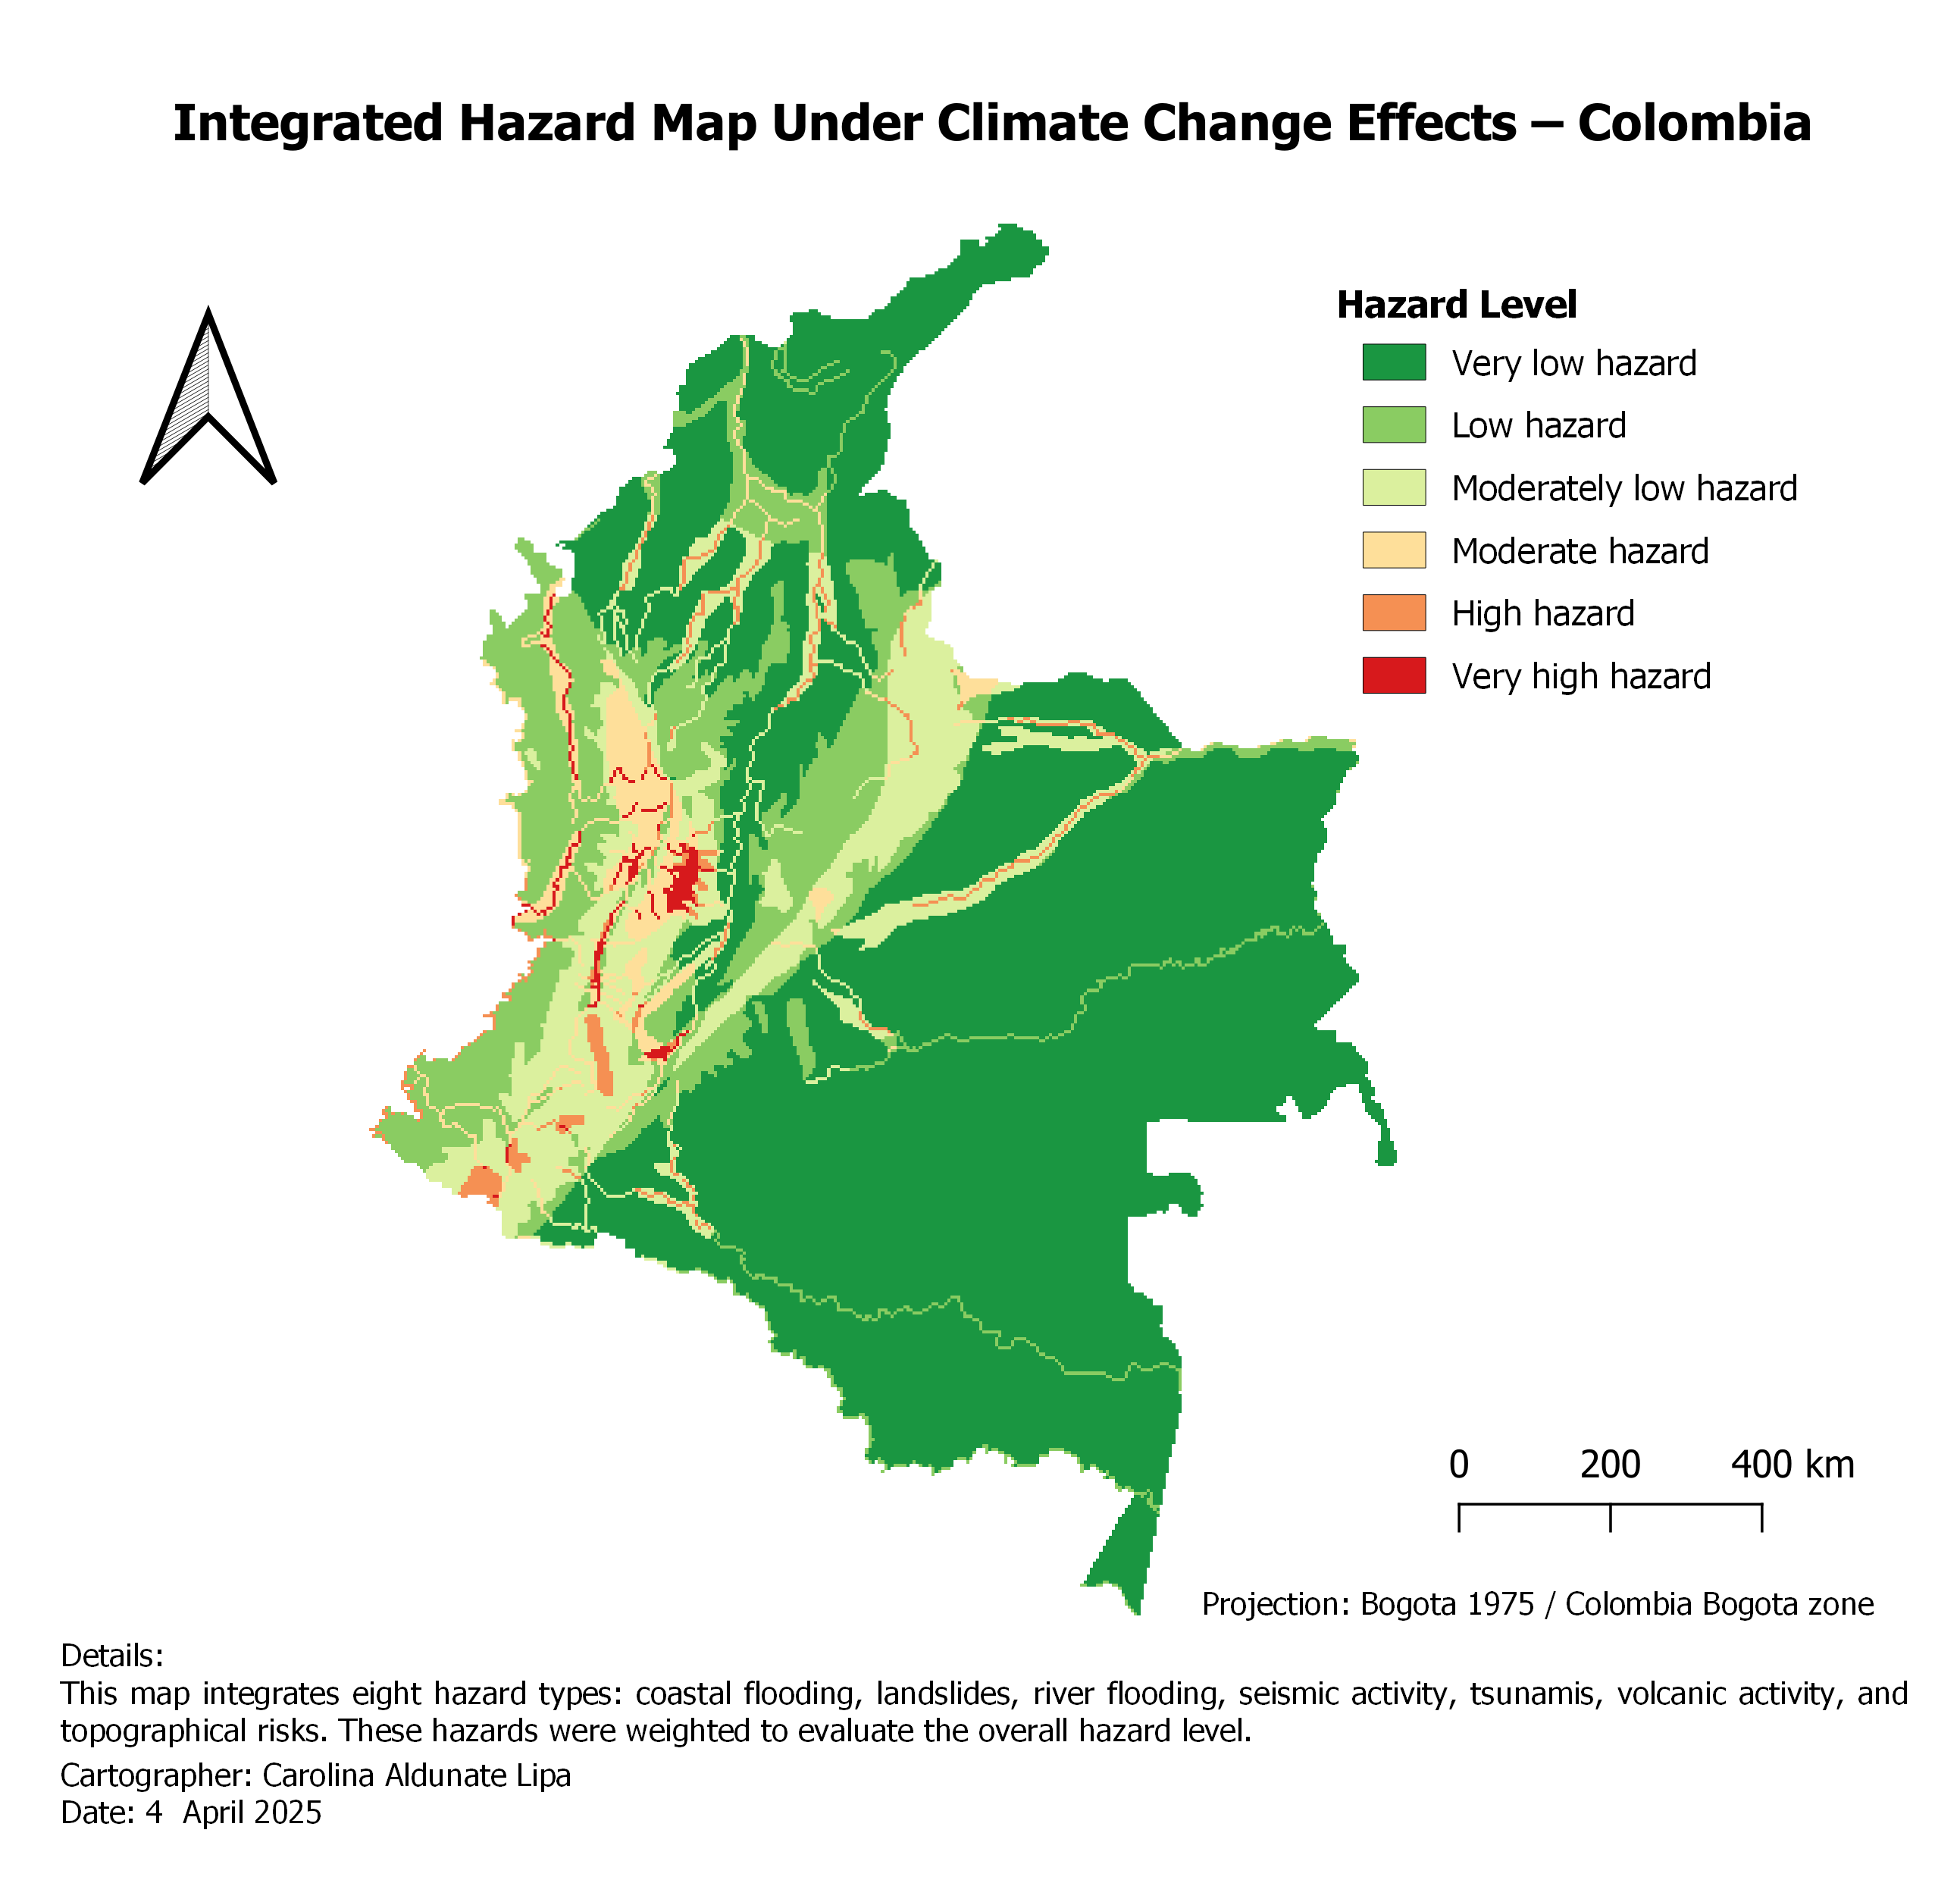
Hazard weights adjusted for coastal erosion, flooding and landslides based on published climate projections.
AquaCrop — Water Productivity and Irrigation Design
Simulated 20 years of maize production in the Lake Kyoga basin (Tororo, Uganda) using the FAO AquaCrop model, comparing rainfed and irrigated systems under different soil types, fertility levels, planting dates, mulching, and irrigation strategies. Found that soil fertility — not soil type — is the dominant constraint on rainfed yield and inter-annual stability, while planting date primarily controls irrigation demand (net irrigation requirement rising from 150.6 mm for mid-September sowing to 241.8 mm for mid-October). Demonstrated that mulching improves ET water productivity (2.00 → 2.17 kg/m³) without increasing yield, and that deficit irrigation achieves 80-85% of fully-irrigated yields using roughly 60% less water — the most water-efficient strategy overall. Delivered both a technical report and a policy-maker summary with differentiated recommendations for farmers, irrigation planners, and policymakers.
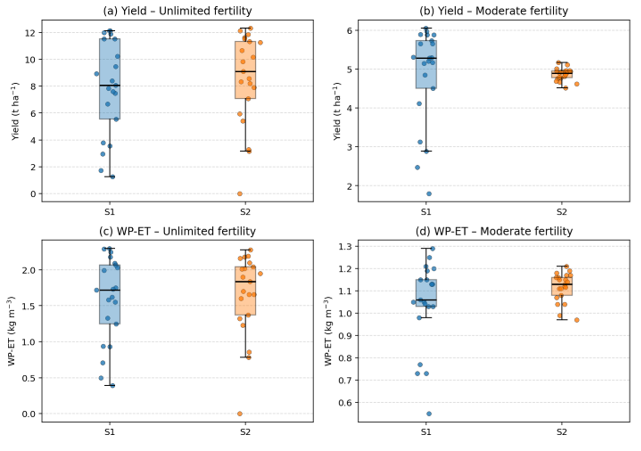
Soil fertility, not soil type, is the dominant constraint: yields converge across both soils under moderate fertility.
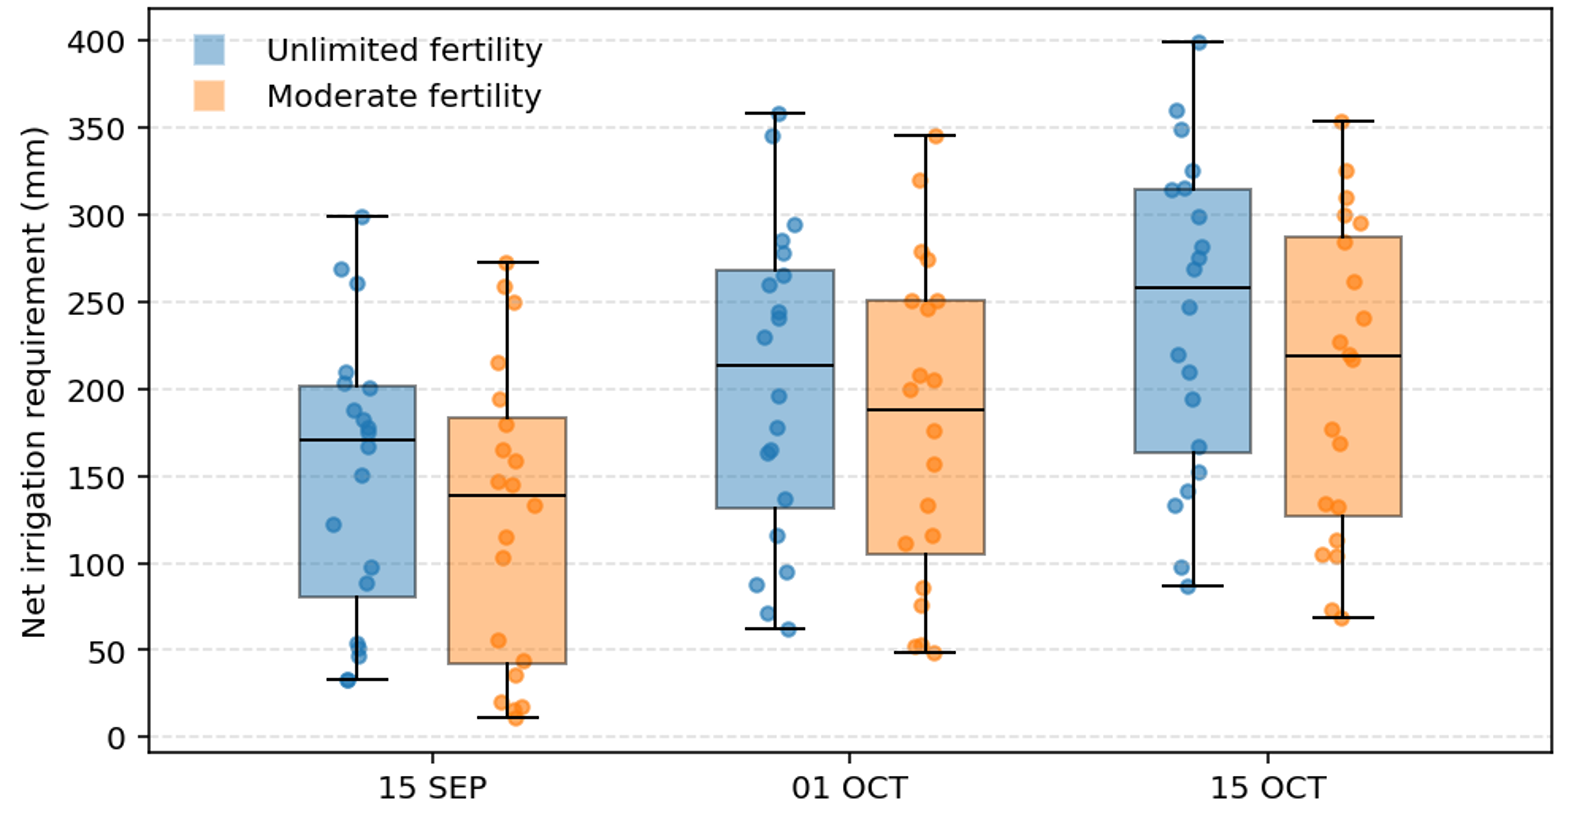
Delayed planting sharply increases irrigation demand, from 150.6 mm to 241.8 mm under unlimited fertility.
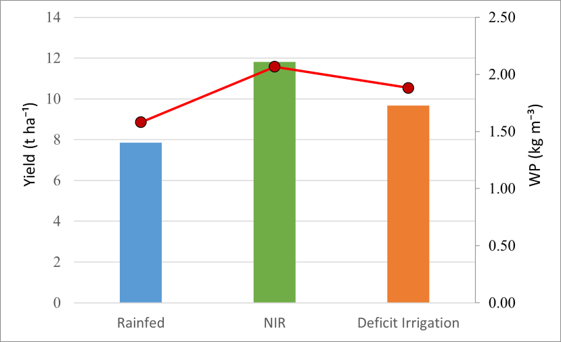
Deficit irrigation achieves yields close to full irrigation while maximizing water productivity.
Statistics for Water Engineering / Stochastic Hydrology
Analyzed streamflow and precipitation time series using hydrograph separation (WETSPRO) to split total flow into overland, interflow and baseflow components, and applied the Peaks Over Threshold (POT) method to extract independent extreme events from both quick-flow and slow-flow periods. Fitted extreme value distributions using the ECQ tool (Willems, 1998), comparing model-simulated maxima against observed maxima before and after applying a climate change scenario, with mean deviation and standard deviation bands to assess goodness-of-fit.
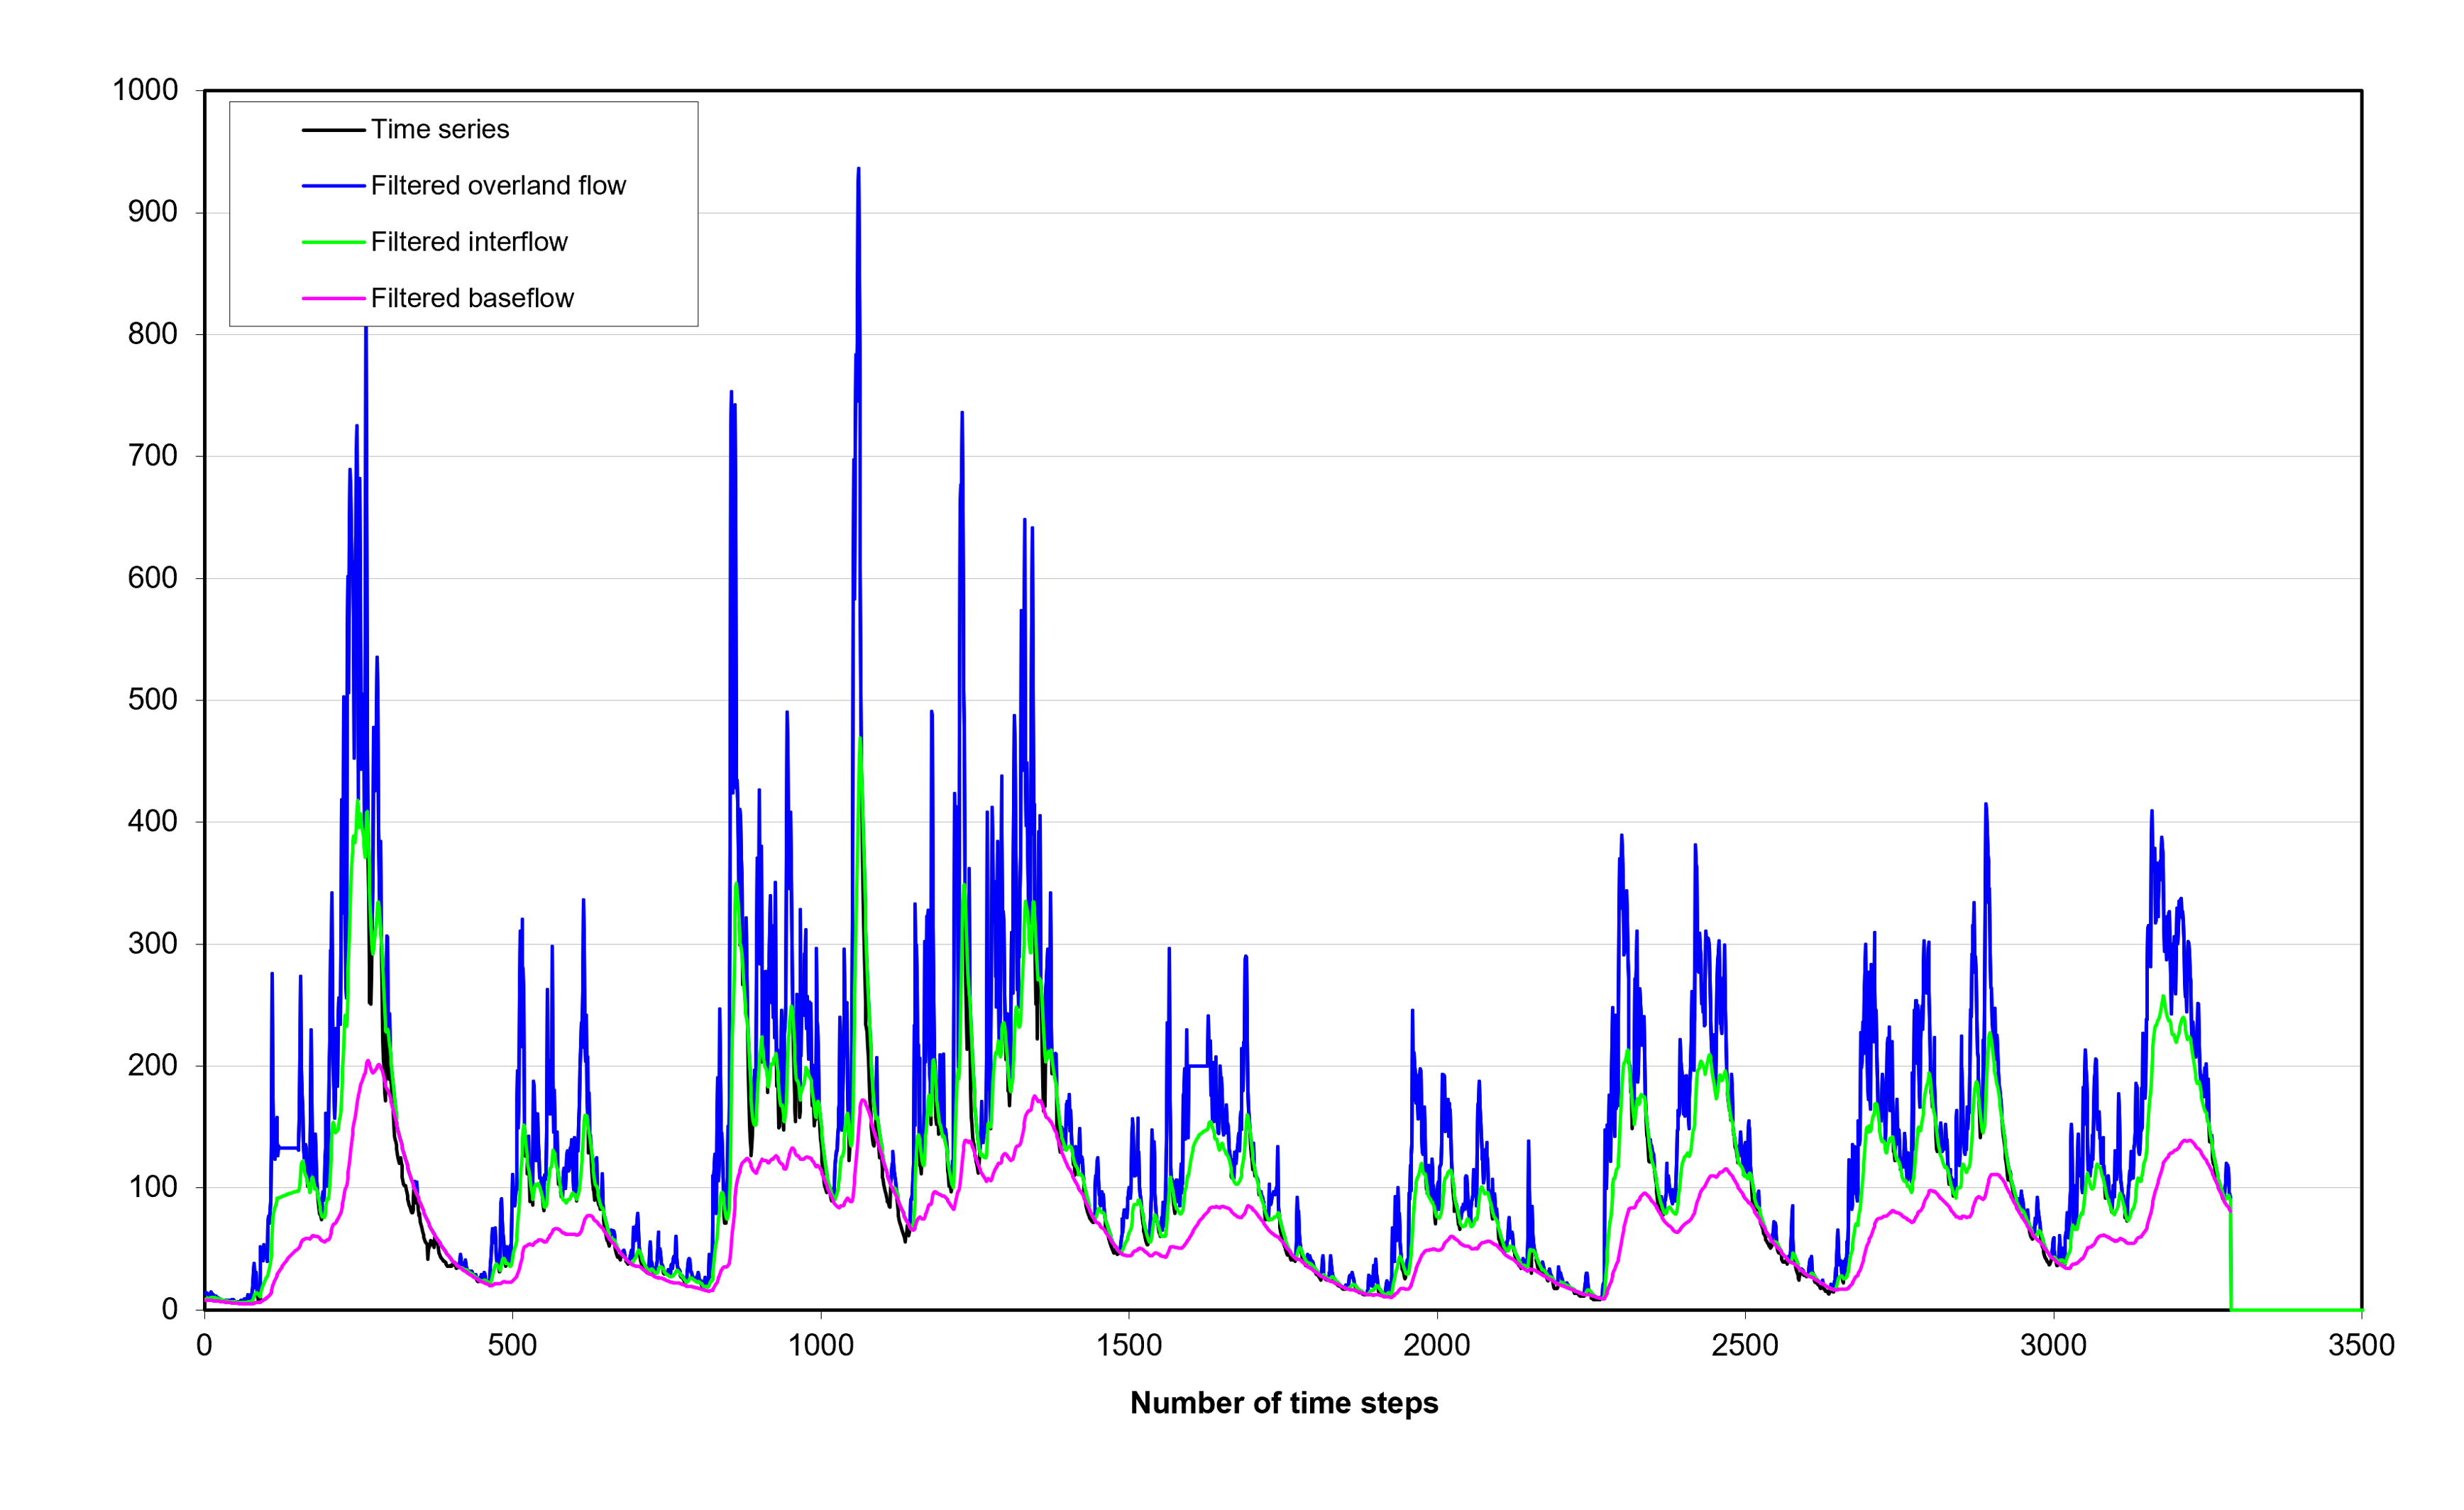
Filters total streamflow into its three main hydrological components.
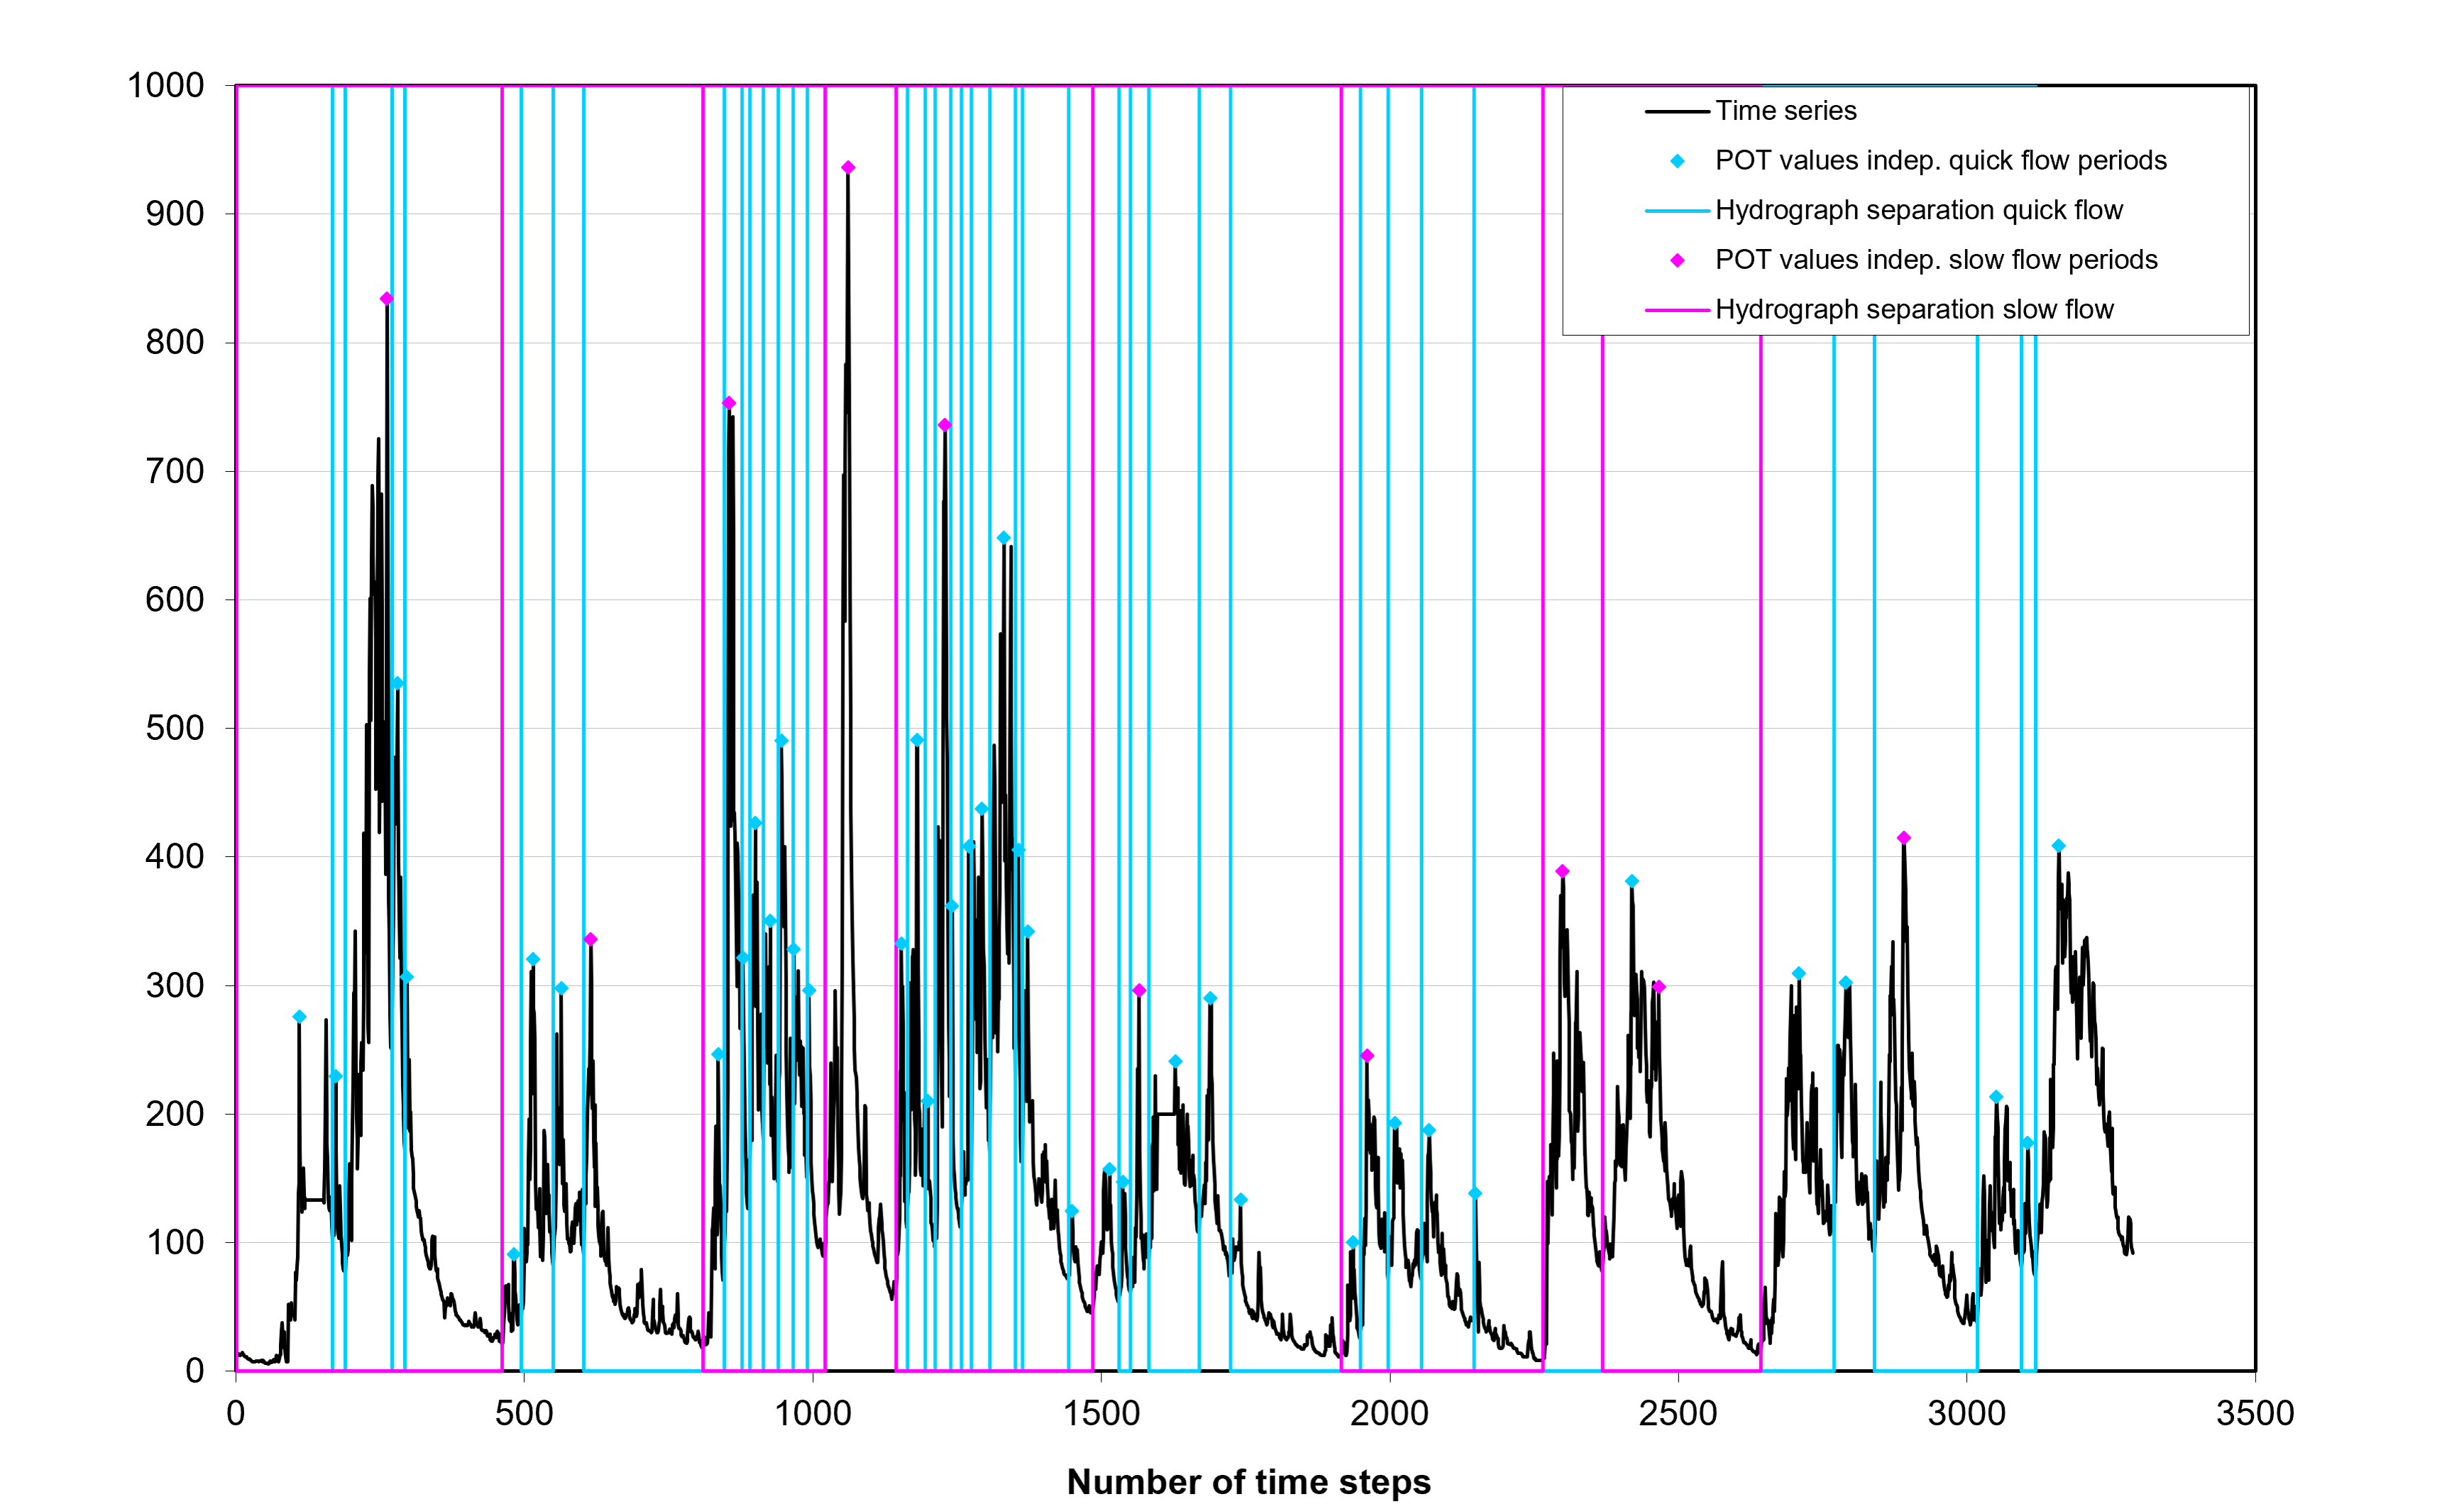
Identifies statistically independent extreme events for subsequent EVA.
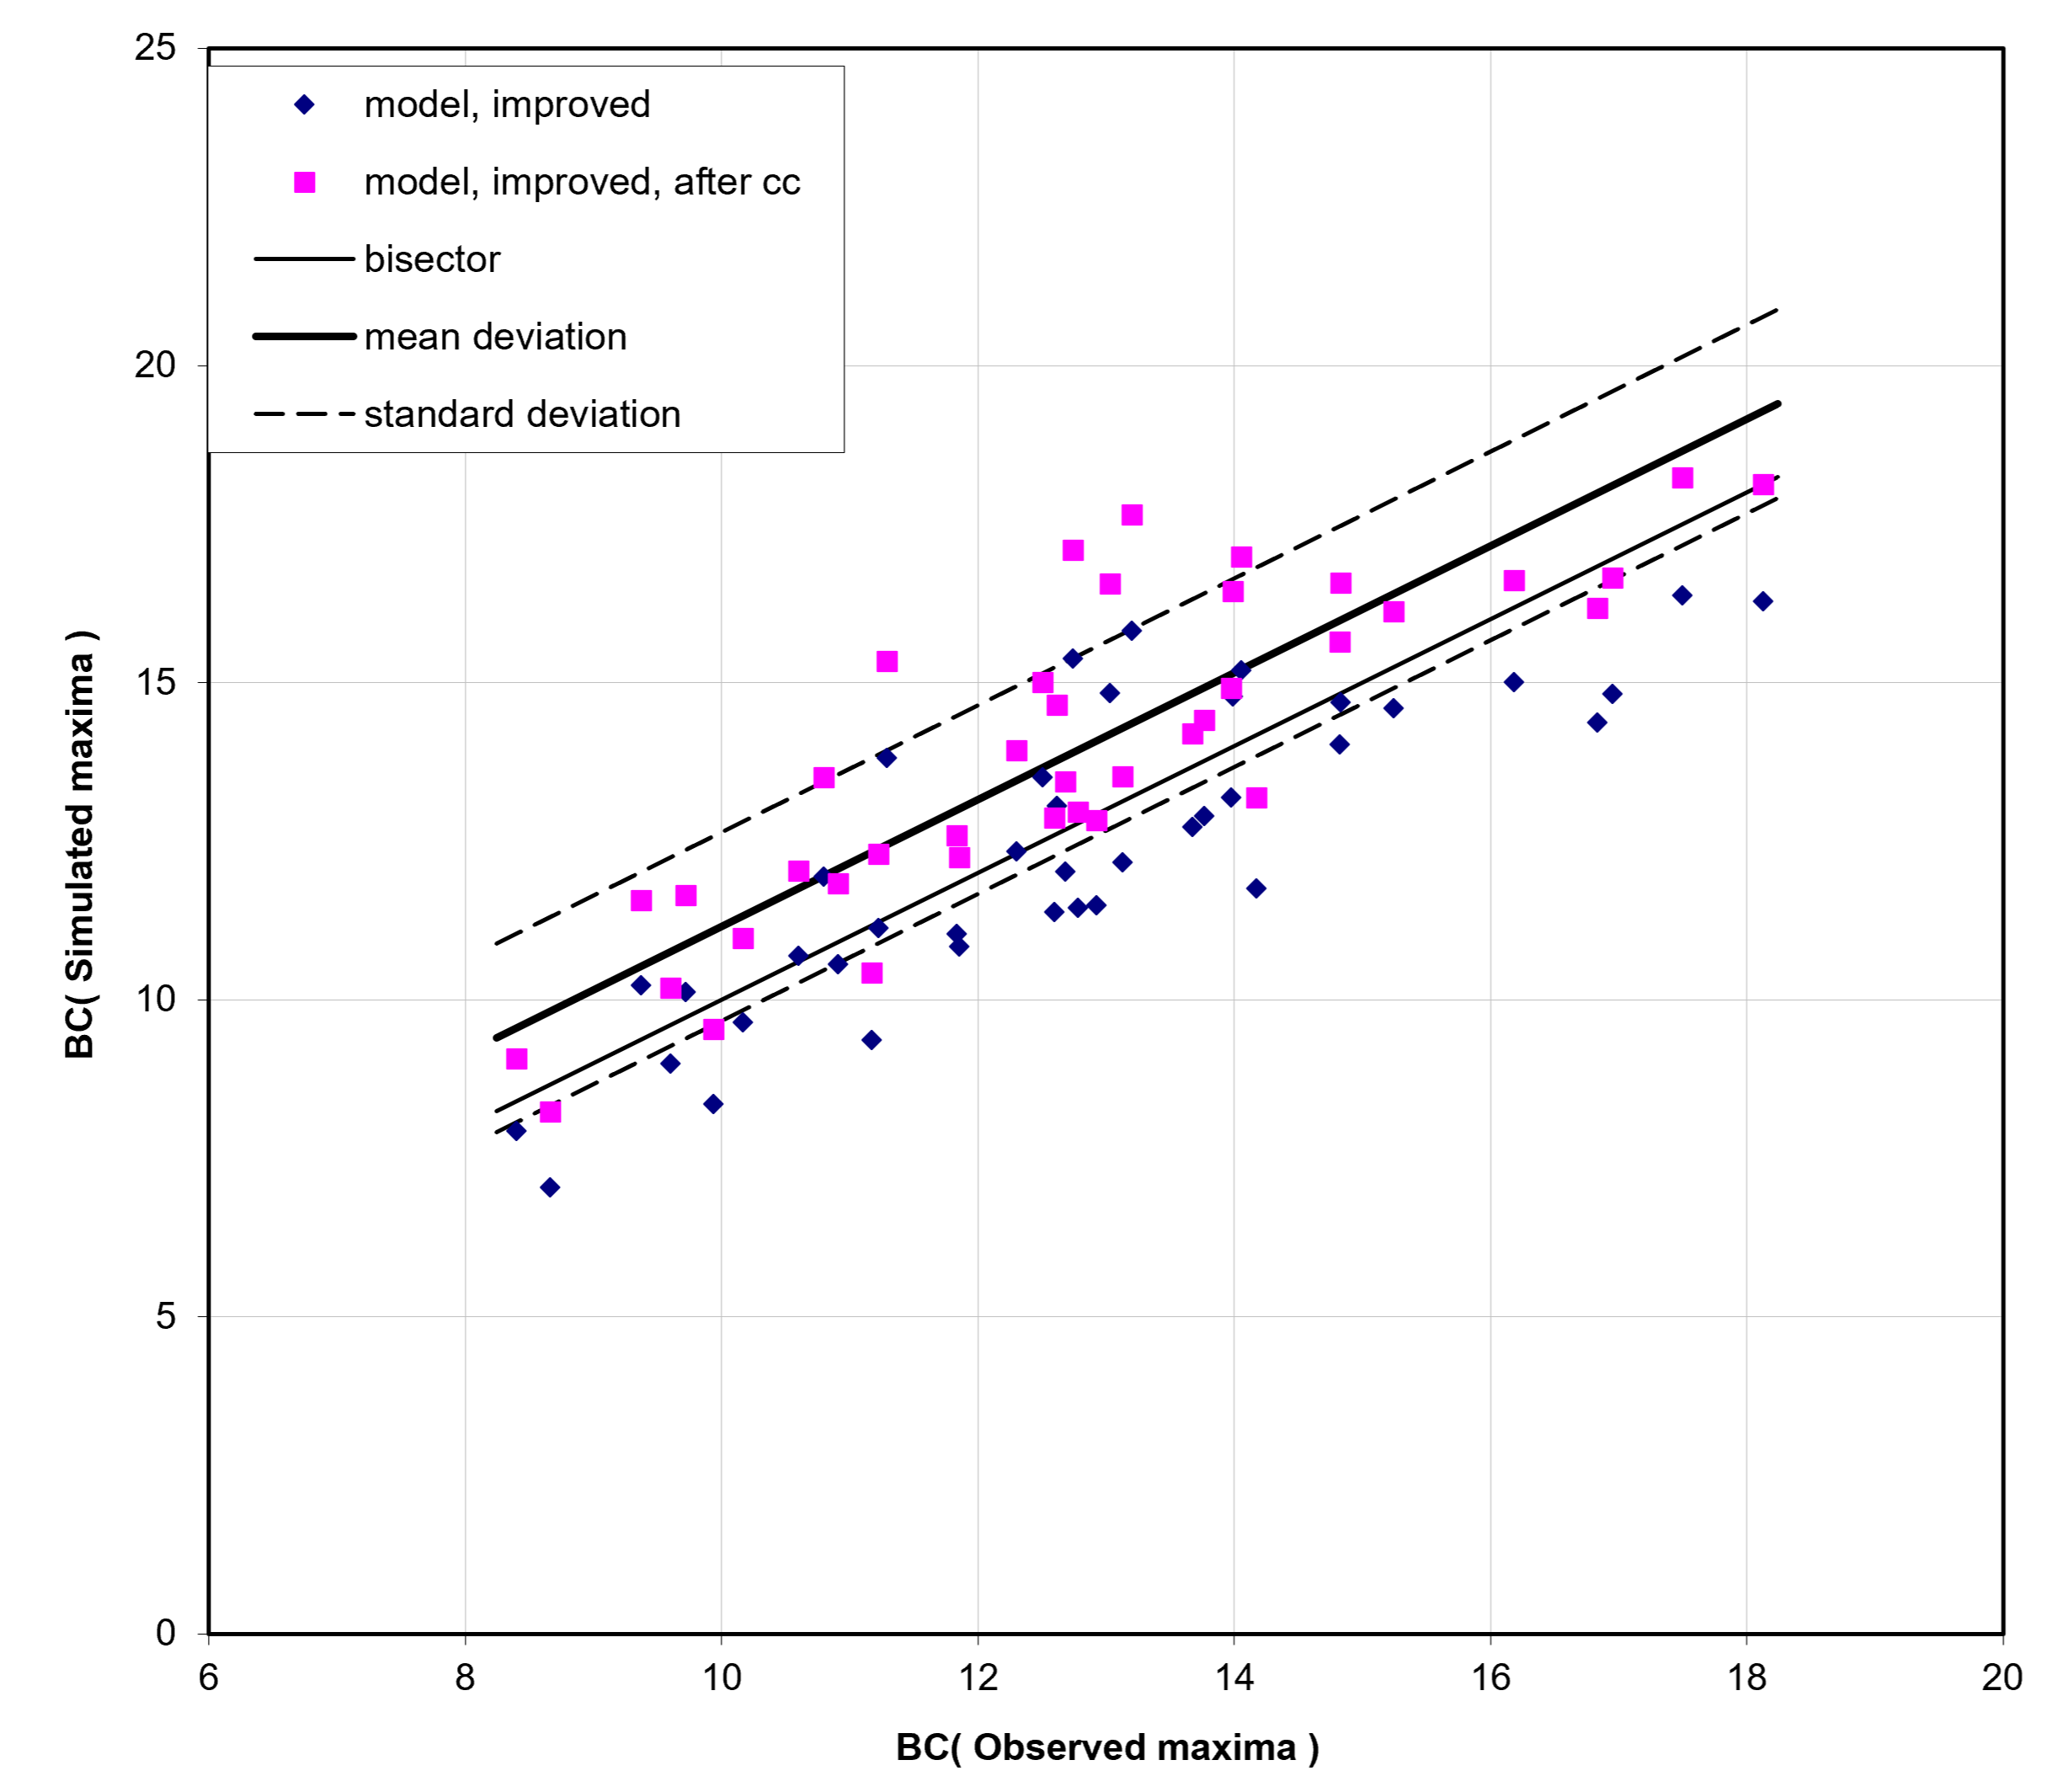
Mean and standard deviation bands assess model goodness-of-fit (ECQ).
River Modelling — Kleine Nete River, Reach 9 (MIKE 11 / MIKE HYDRO)
As a group project, we built a 1D hydrodynamic river model and a quasi-2D floodplain model for the Kleine Nete catchment (Belgium) using MIKE 11 and MIKE HYDRO, validating channel capacity under baseline and amplified discharge scenarios. We derived composite design hydrographs for 10-, 100- and 1000-year return periods (WETSPRO/ECQ) and validated the floodplain model against historical and official flood hazard maps, finding that only the T1000 scenario produced significant flooding, due to upstream storage attenuation.
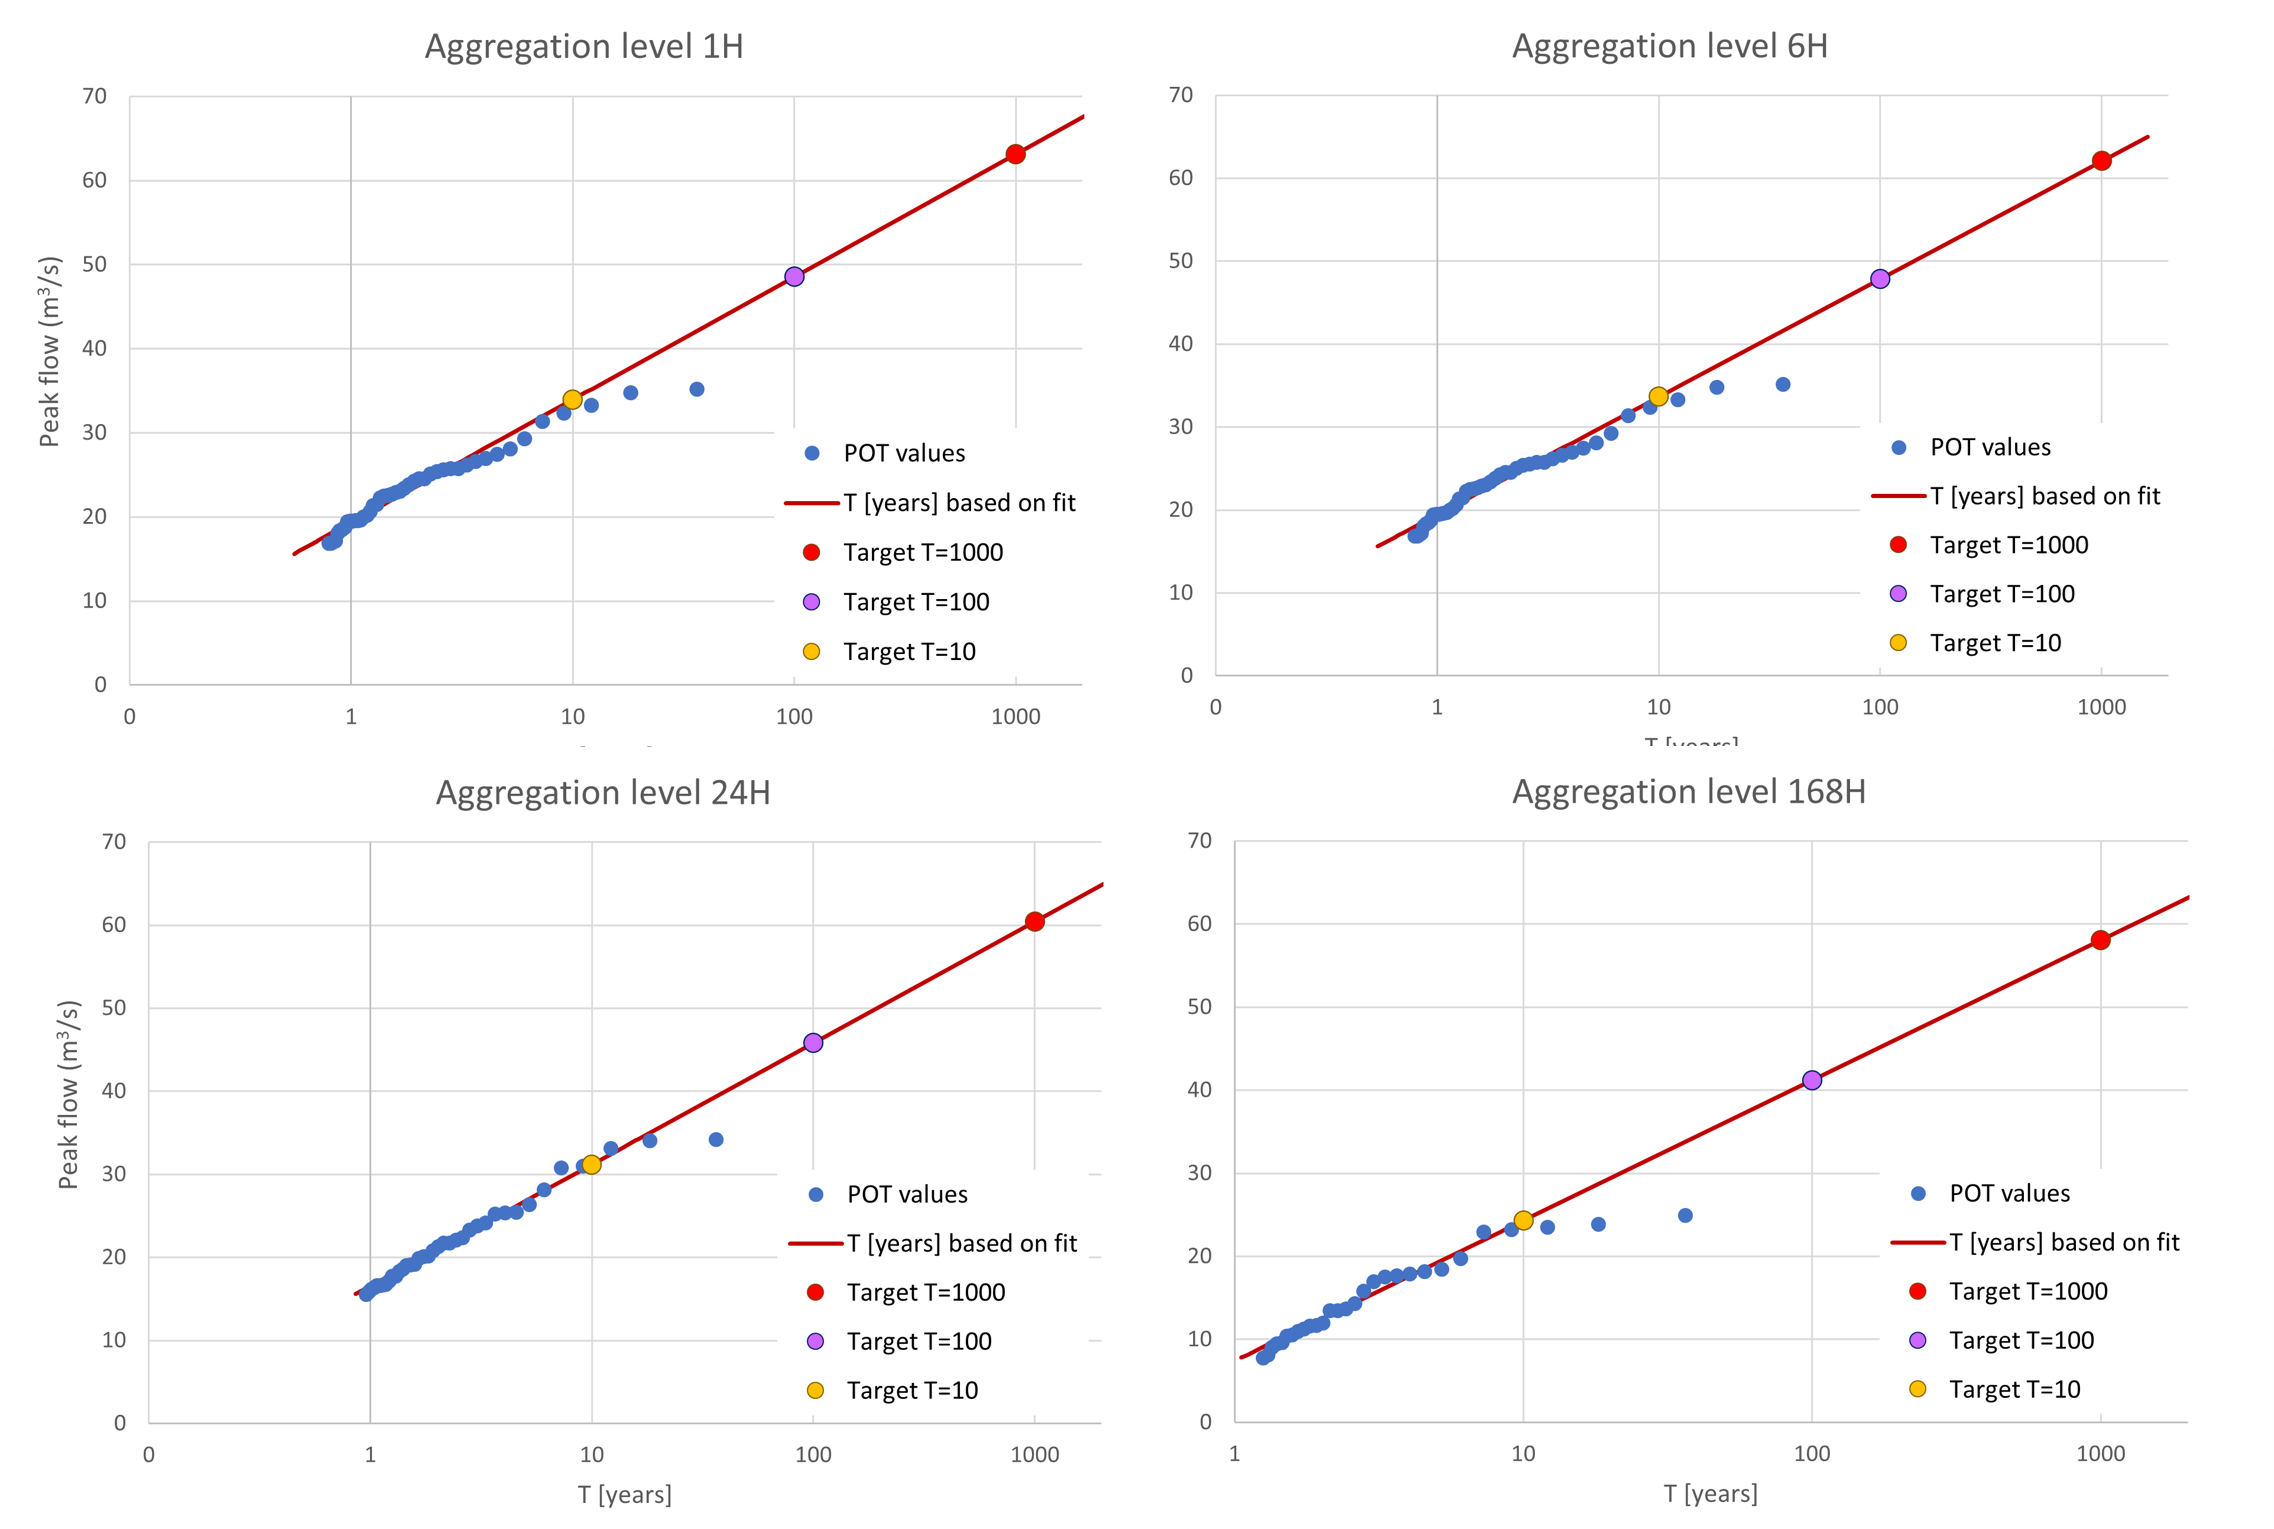
Peak flows fitted to return periods (POT/ECQ) provide the design values for the 10-, 100- and 1000-year composite hydrographs.
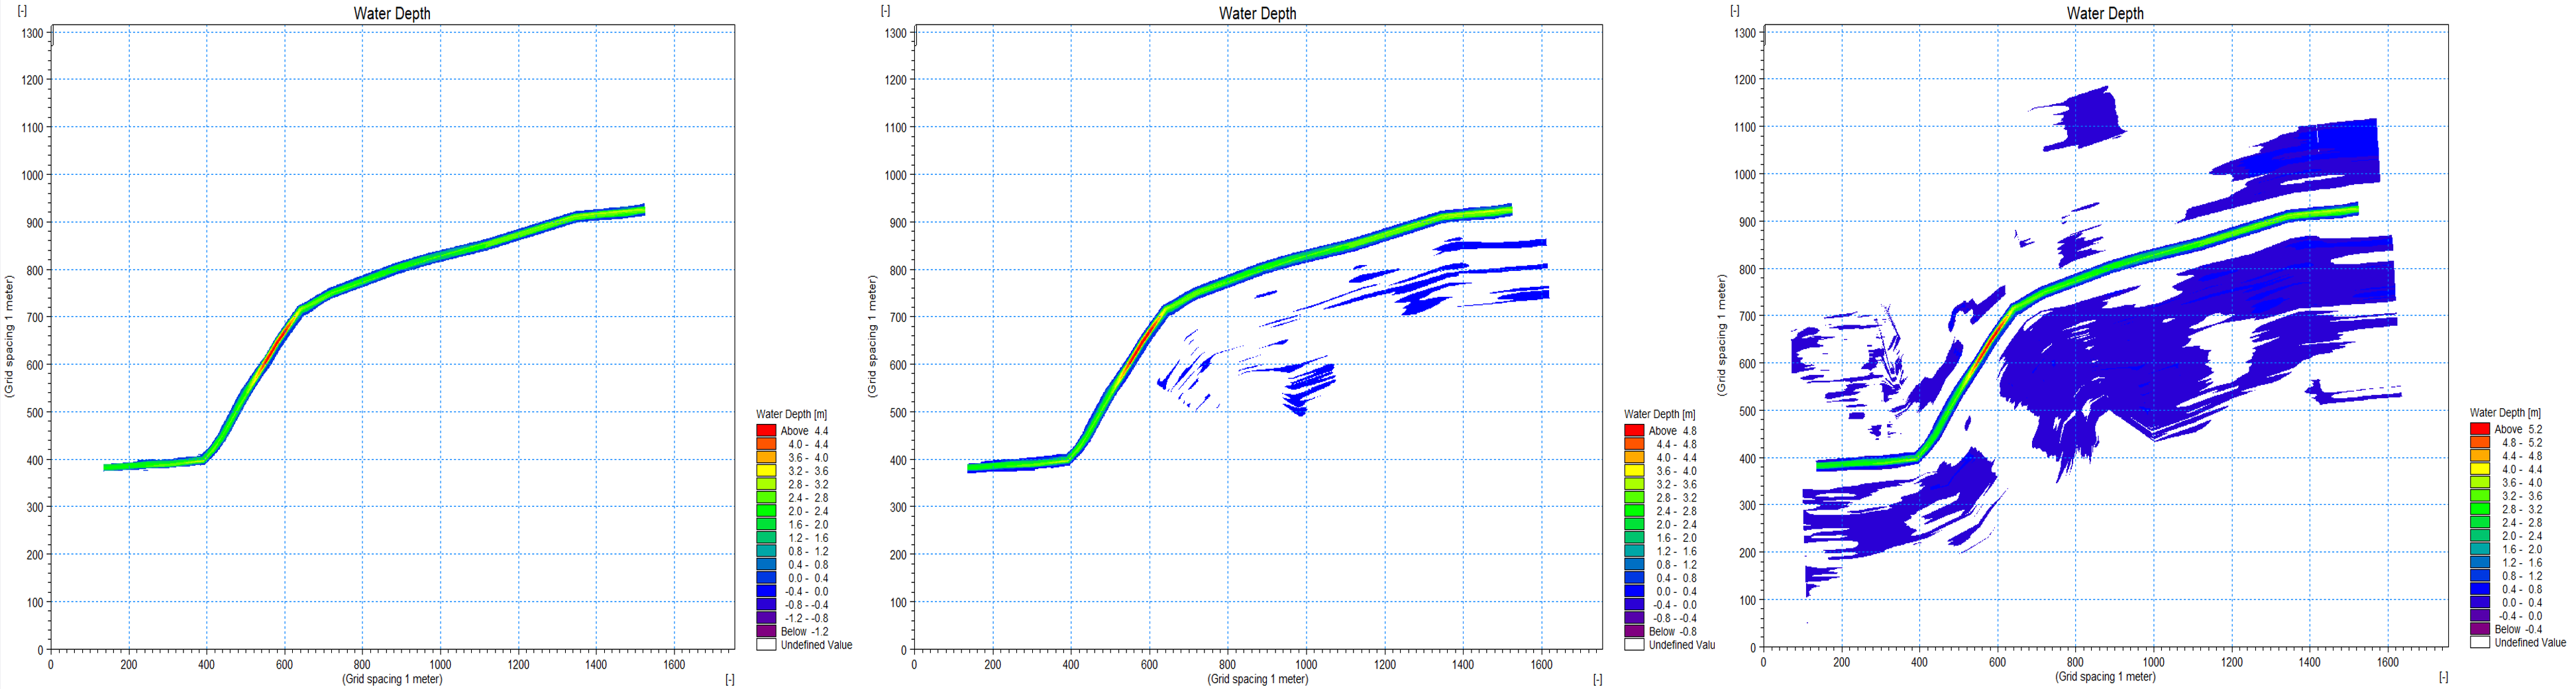
Only the T1000 composite hydrograph produces flood extents comparable to official Waterinfo flood hazard maps.
Technical skills
- Languages: Python.
- Python Libraries: pandas, NumPy, SciPy, scikit-learn, statsmodels, Matplotlib, Seaborn, xarray, iris, regionmask.
- Remote Sensing & GIS: Google Earth Engine, QGIS (map algebra, raster calculator).
- Hydrological & Crop Modelling: SWAT+, AquaCrop (FAO), MIKE 11, MIKE HYDRO.
- Statistical Hydrology Tools: WETSPRO (hydrograph separation), ECQ (extreme value analysis, Willems 1998).
- Version Control Systems: Git and GitHub.
Certificate in Machine Learning Cloud
Universidad Católica Boliviana San Pablo
Description
This course provides competencies in using cloud computing resources to perform machine learning tasks that allow machines to learn from data and improve their performance for information analysis, pattern recognition, and process automation.
The main skills developed are:
- Extract, transform, prepare, and load data for applications.
- Data Wrangling and Statistical Data Analysis.
- Automation of machine learning models and hyperparameter tuning.
- Deploy and use of a cloud model.
Technical skills
- Languages: Python.
- Python Libraries: requests, jsonpath_ng, Beautiful Soup, Pandas, Numpy, Scipy, Matplotlib, Seaborn, Scikit-Learn, Tensorflow, Azure Machine Learning.
SDK, pickle
- Version Control Systems: Git and GitHub.
- Development Tools: Visual Studio.
Principal projects
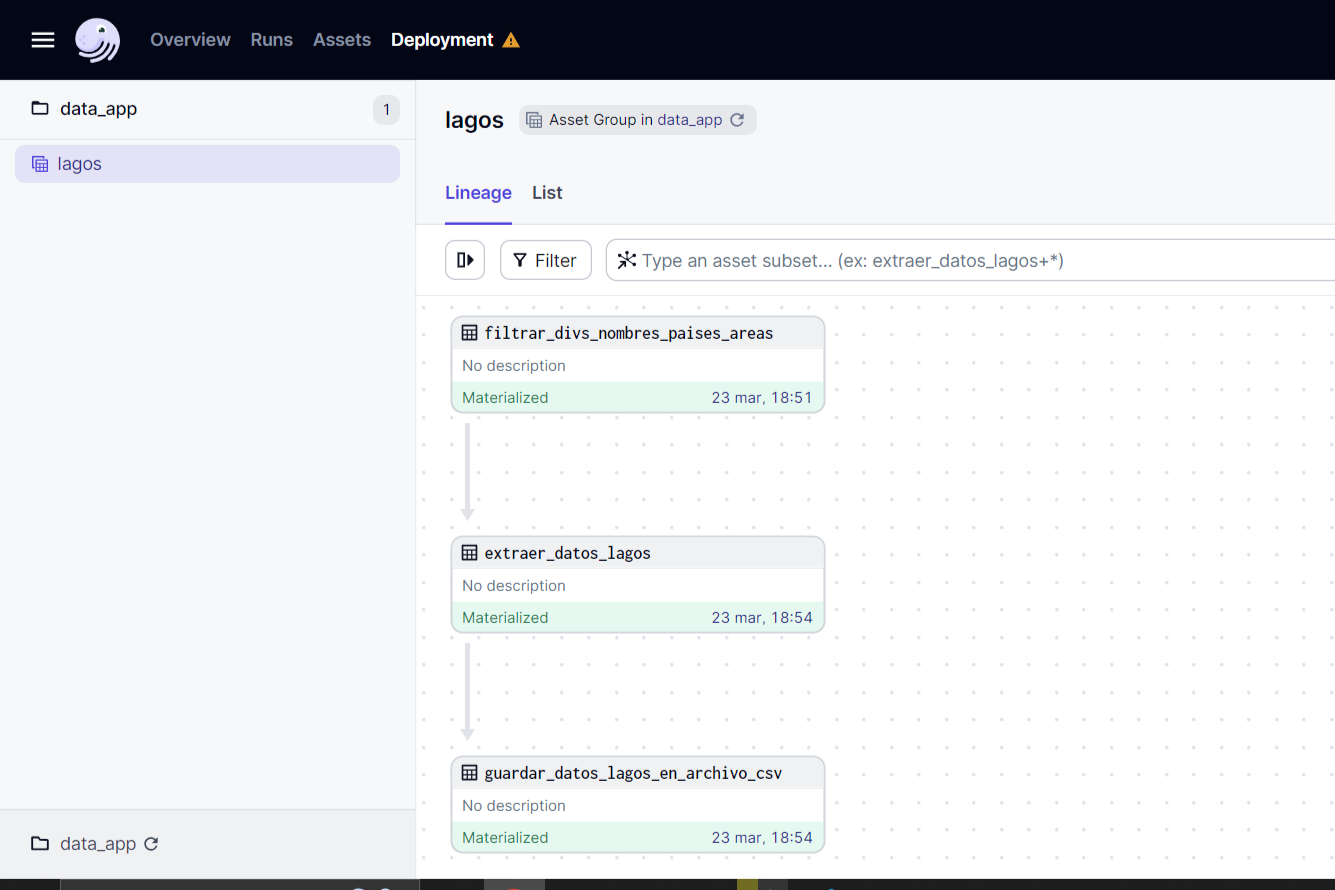
Made using Dagster.
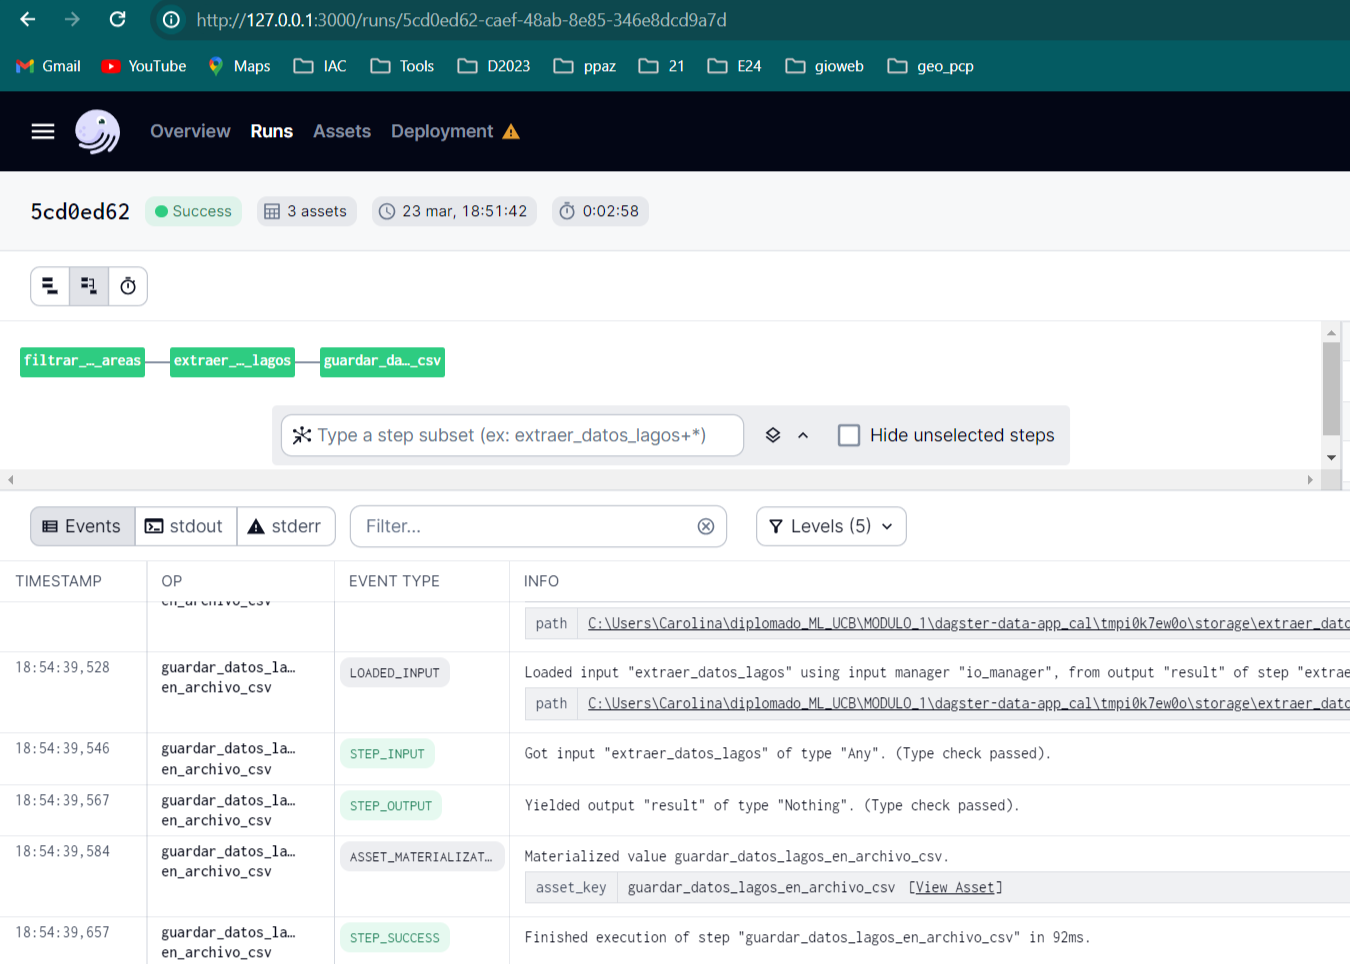
Made using Dagster.
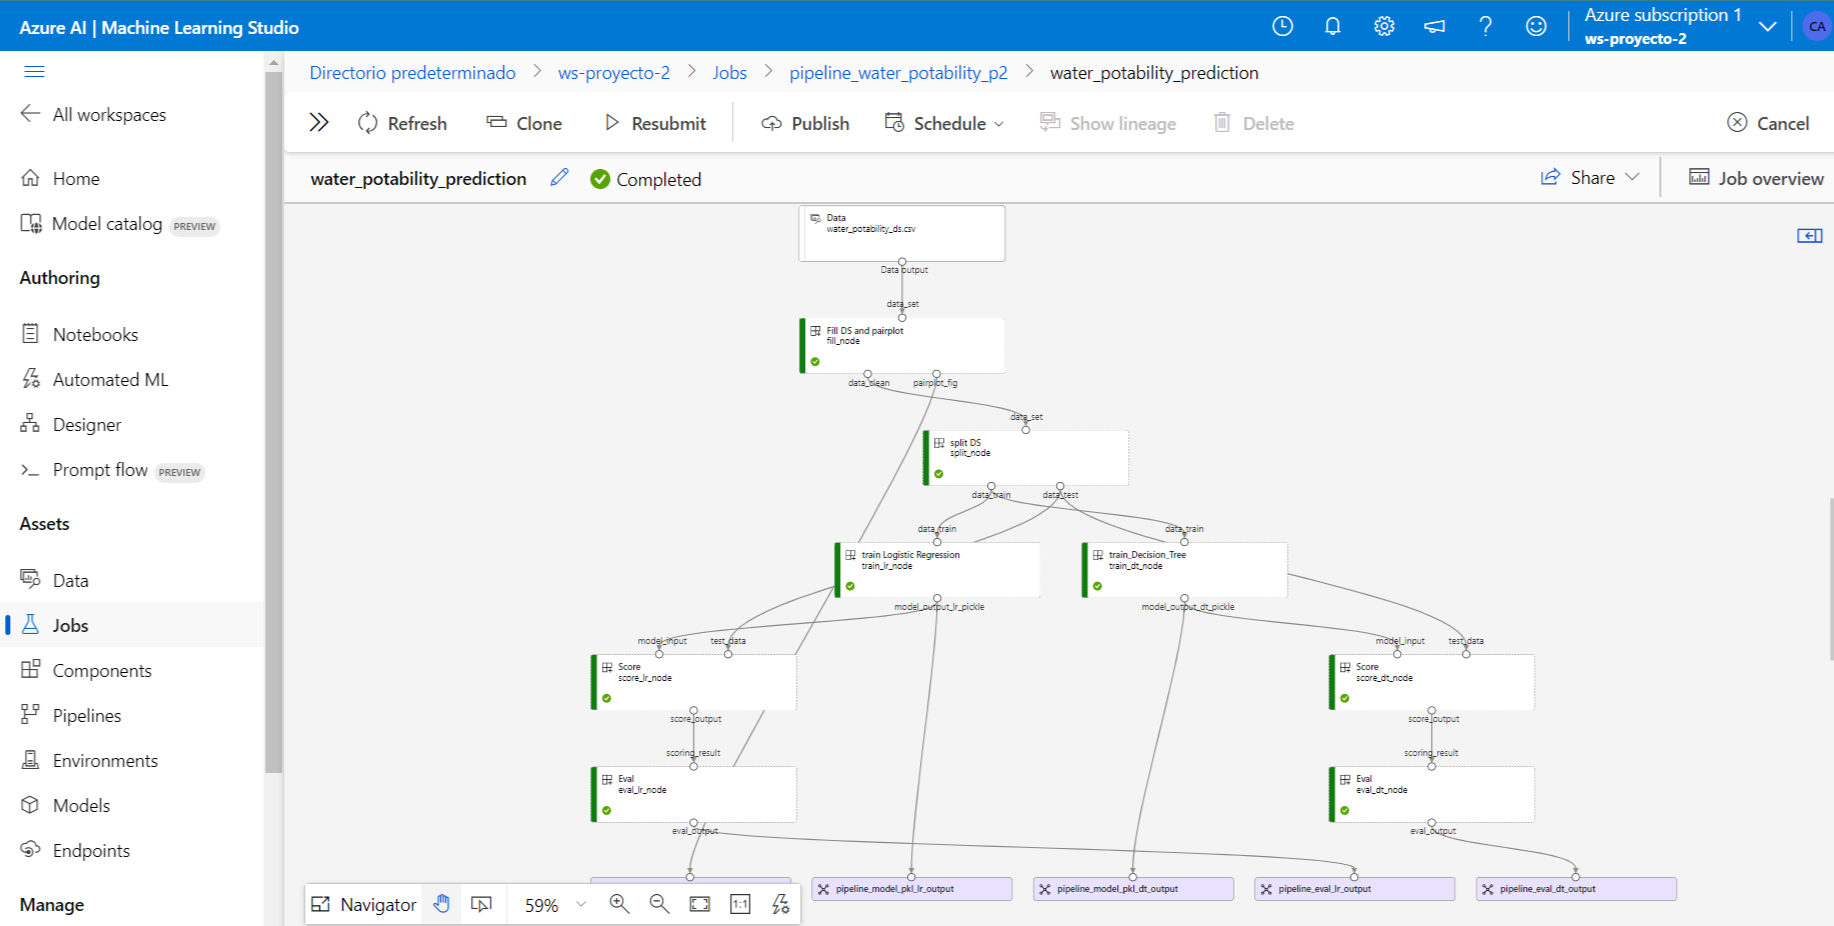
Made using Azure Machine Learning, Scikit-Learn
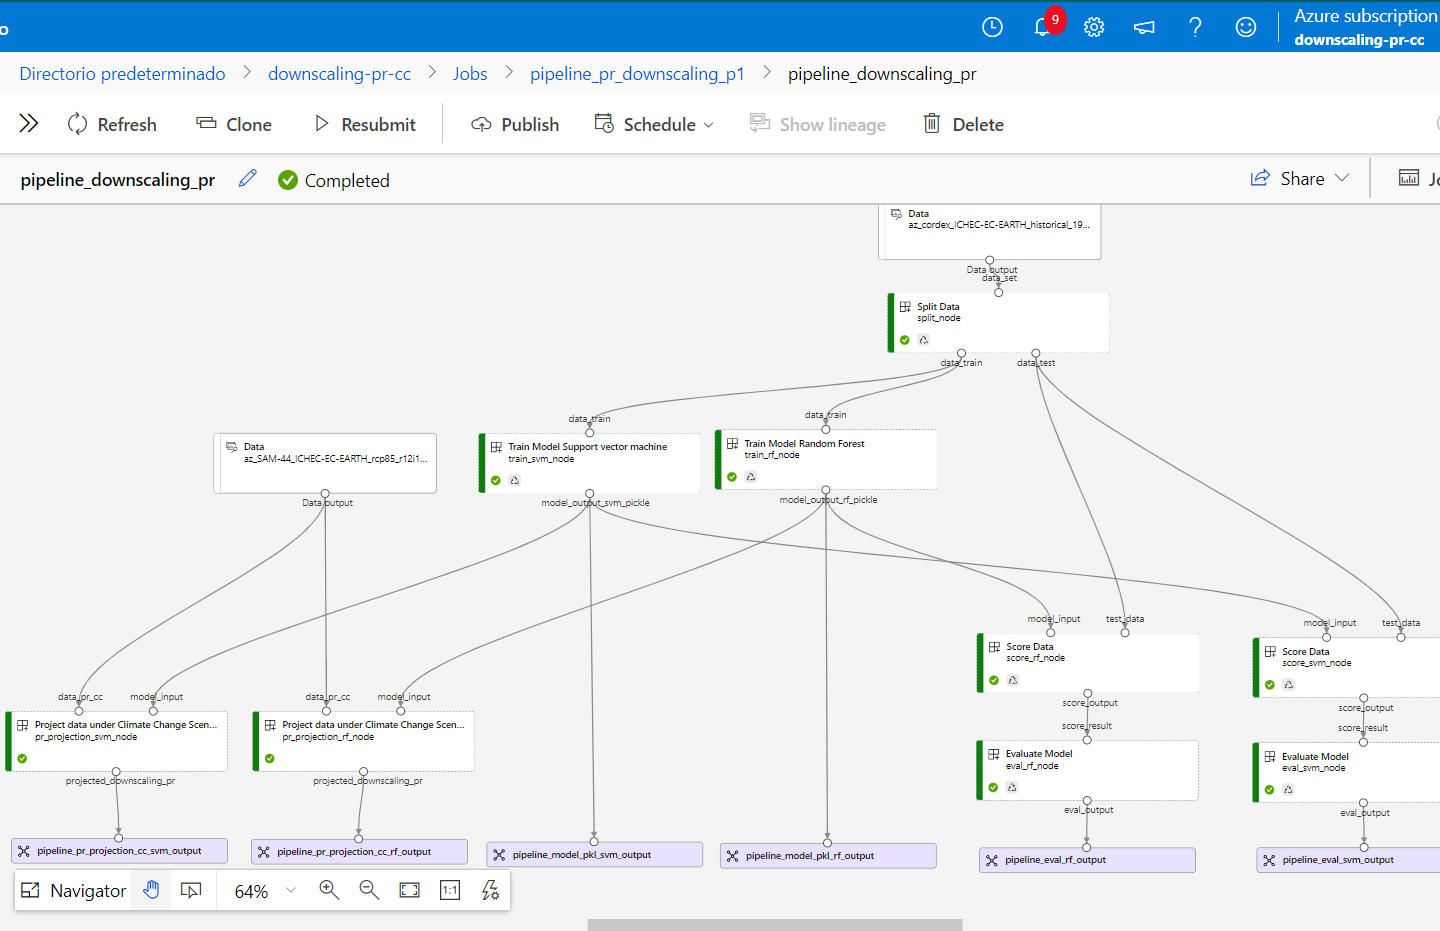
Made using Azure Machine Learning, Scikit-Learn
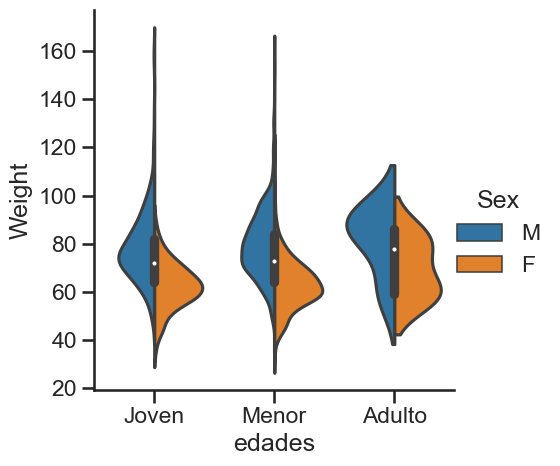
Made usingMade using Python, Pandas, and SeaBorn.
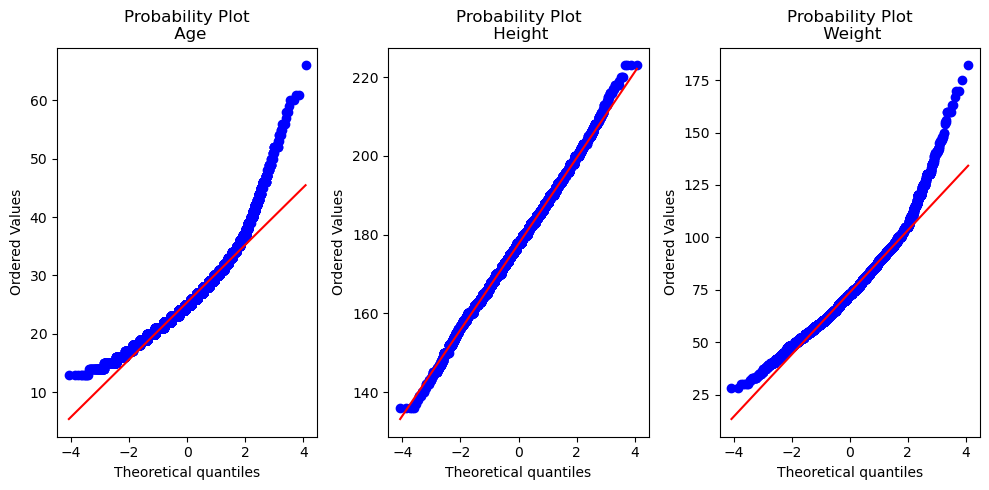
Made using Python, Scipy and Matplotlib.
Bachelor Of Science in Civil Engineering
Universidad Mayor de San Simón
Thesis project: Impact of Climate Change on the use of water potential in a pilot basin in Bolivia
Description
The degree project aimed to assess the potential effects of climate change on determining the hydrological level of a reservoir. To achieve this, a case study was conducted on a dam planned for the upper basin of the Piraí River, in Bolivia. The adopted climate change scenarios utilize two representative greenhouse gas concentration trajectories, namely RCP 4.5 and RCP 8.5 in two future periods: 2050s (2036-2065) and 2080s (2070-2099). These are applied using three statistical downscaling methods:
To achieve the goals, I created two resource tools:
Technical skills
- Hydrology Modeling: HydroBID.
- Languages: Python and R.
- Python Libraries: NumPy, Pandas, Xarray, NetCDF, Matplotlib, Plotly, Tkinter
- Version Control Systems: Git and GitHub.
- Development Tools: Spyder and Rstudio
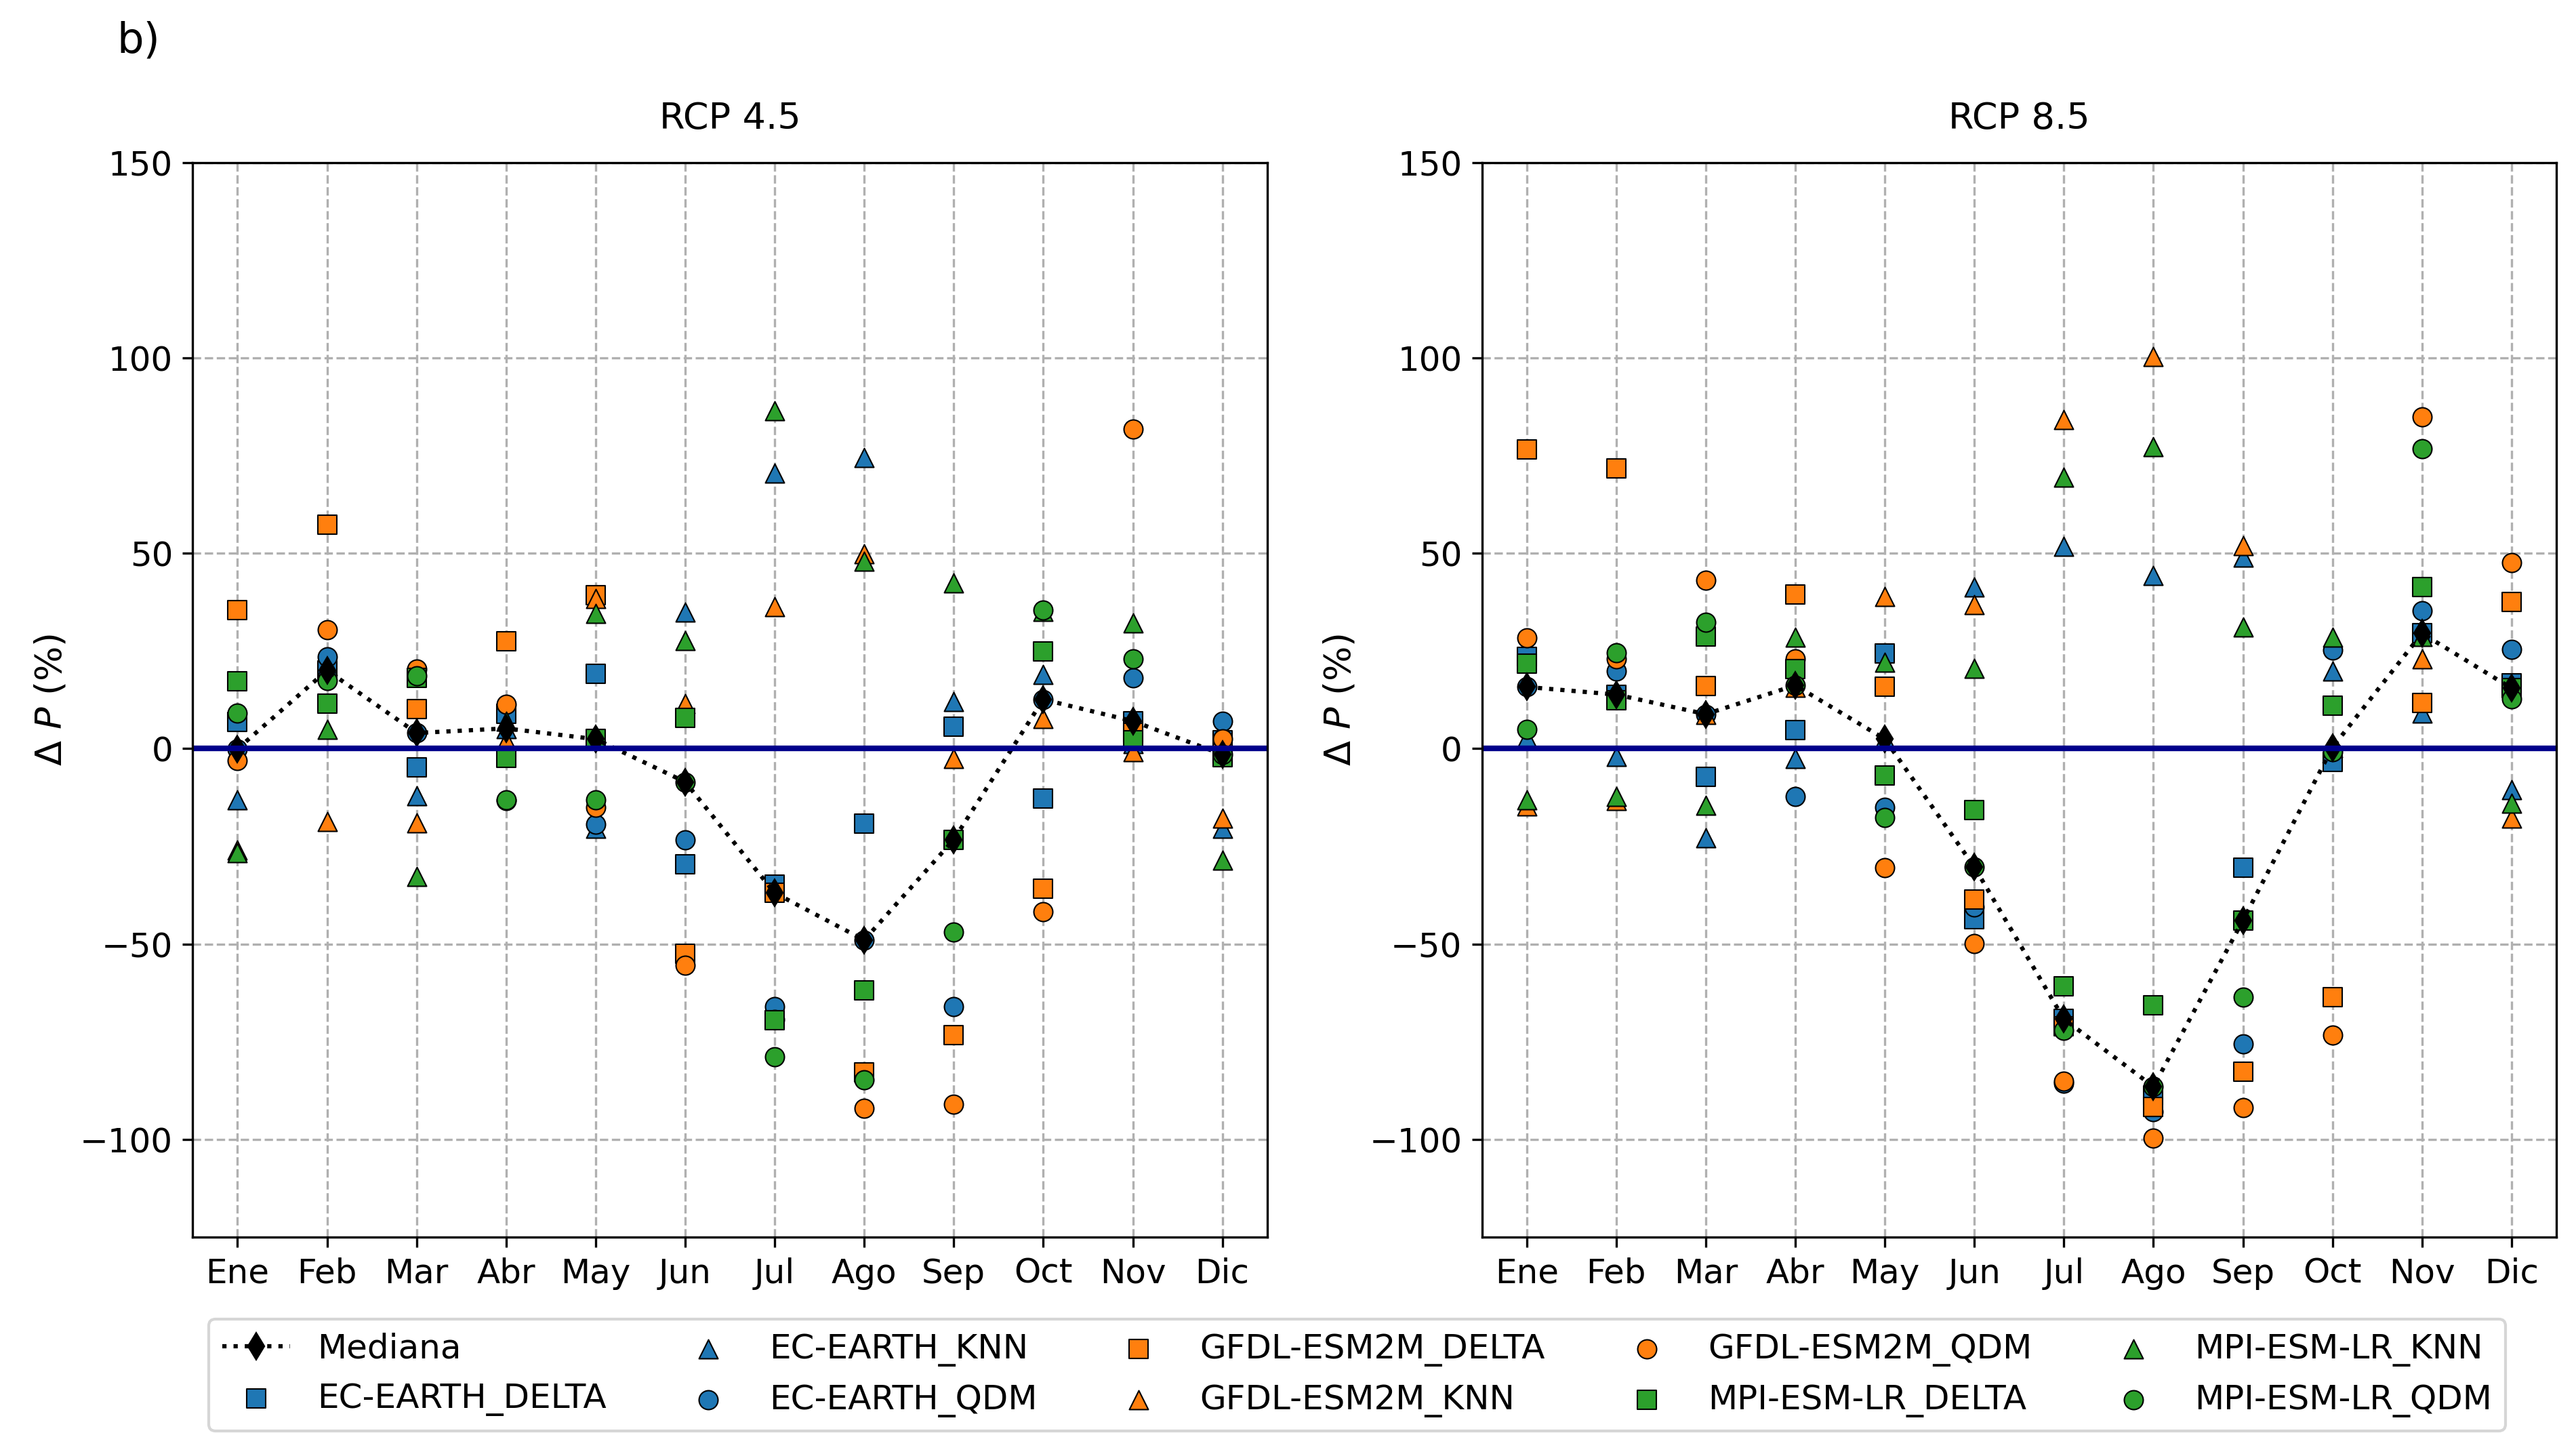
Made using dClimate, Matplotlib.
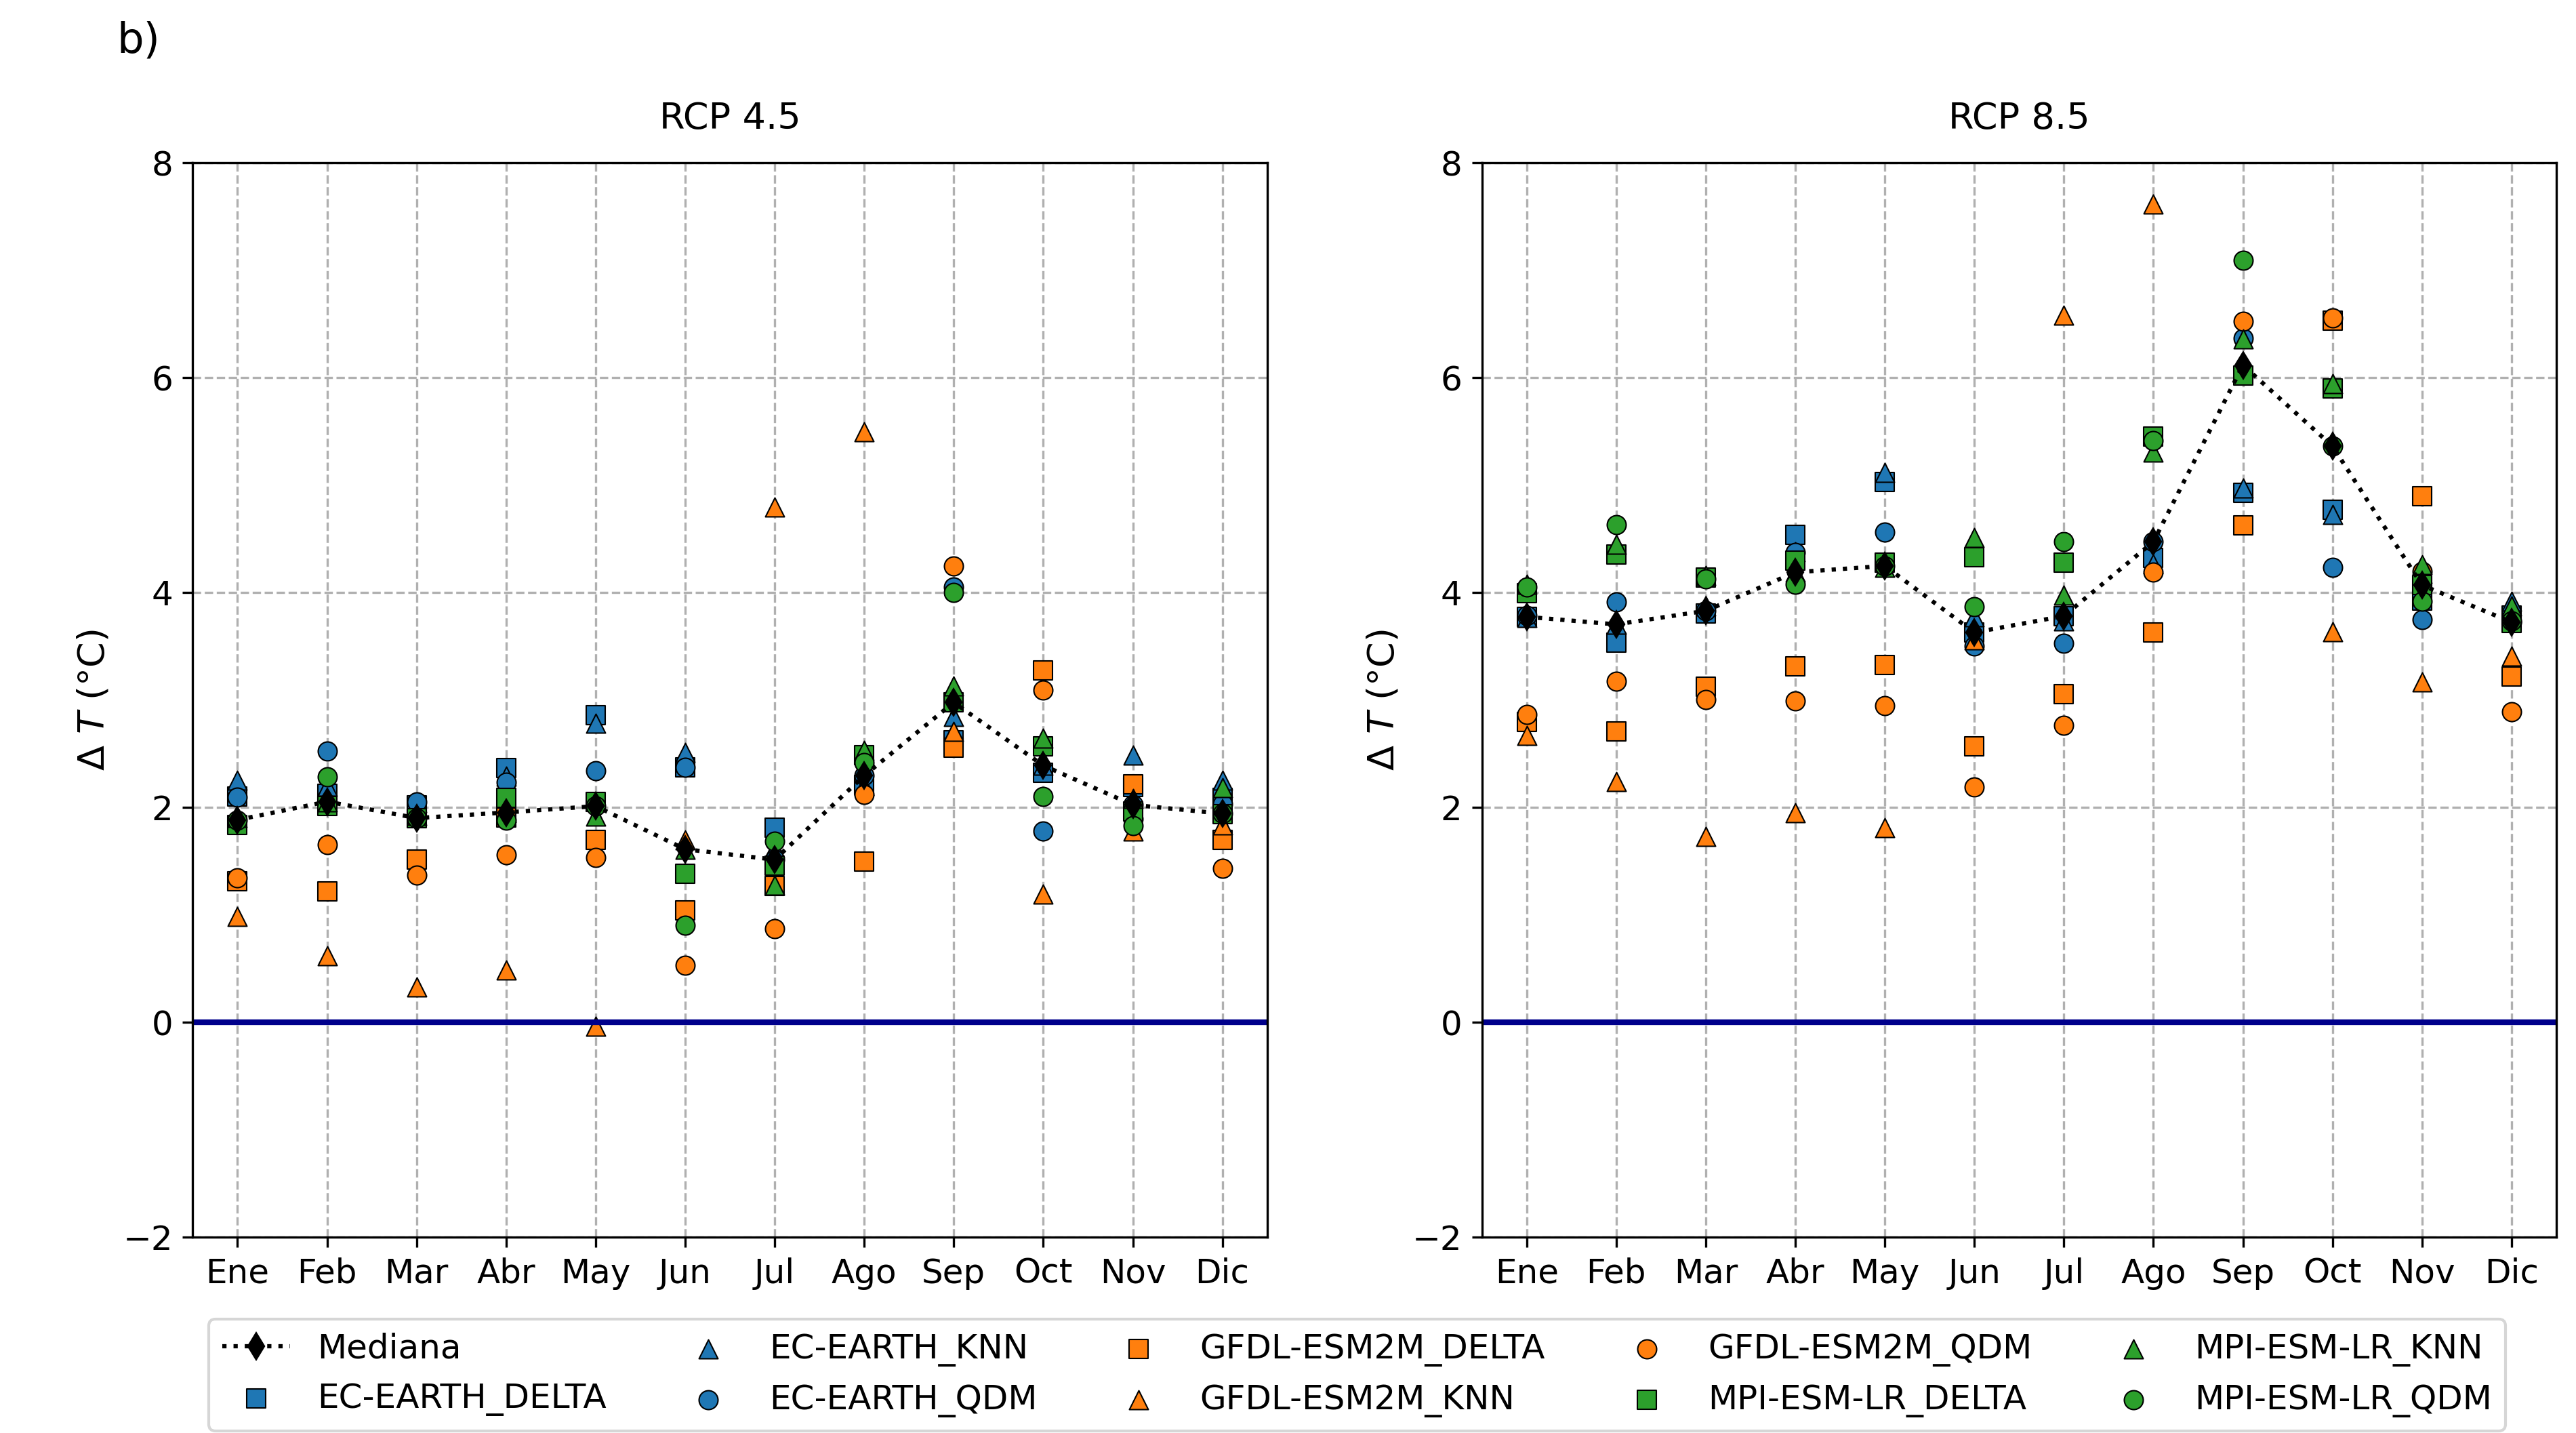
Made using dClimate, Matplotlib
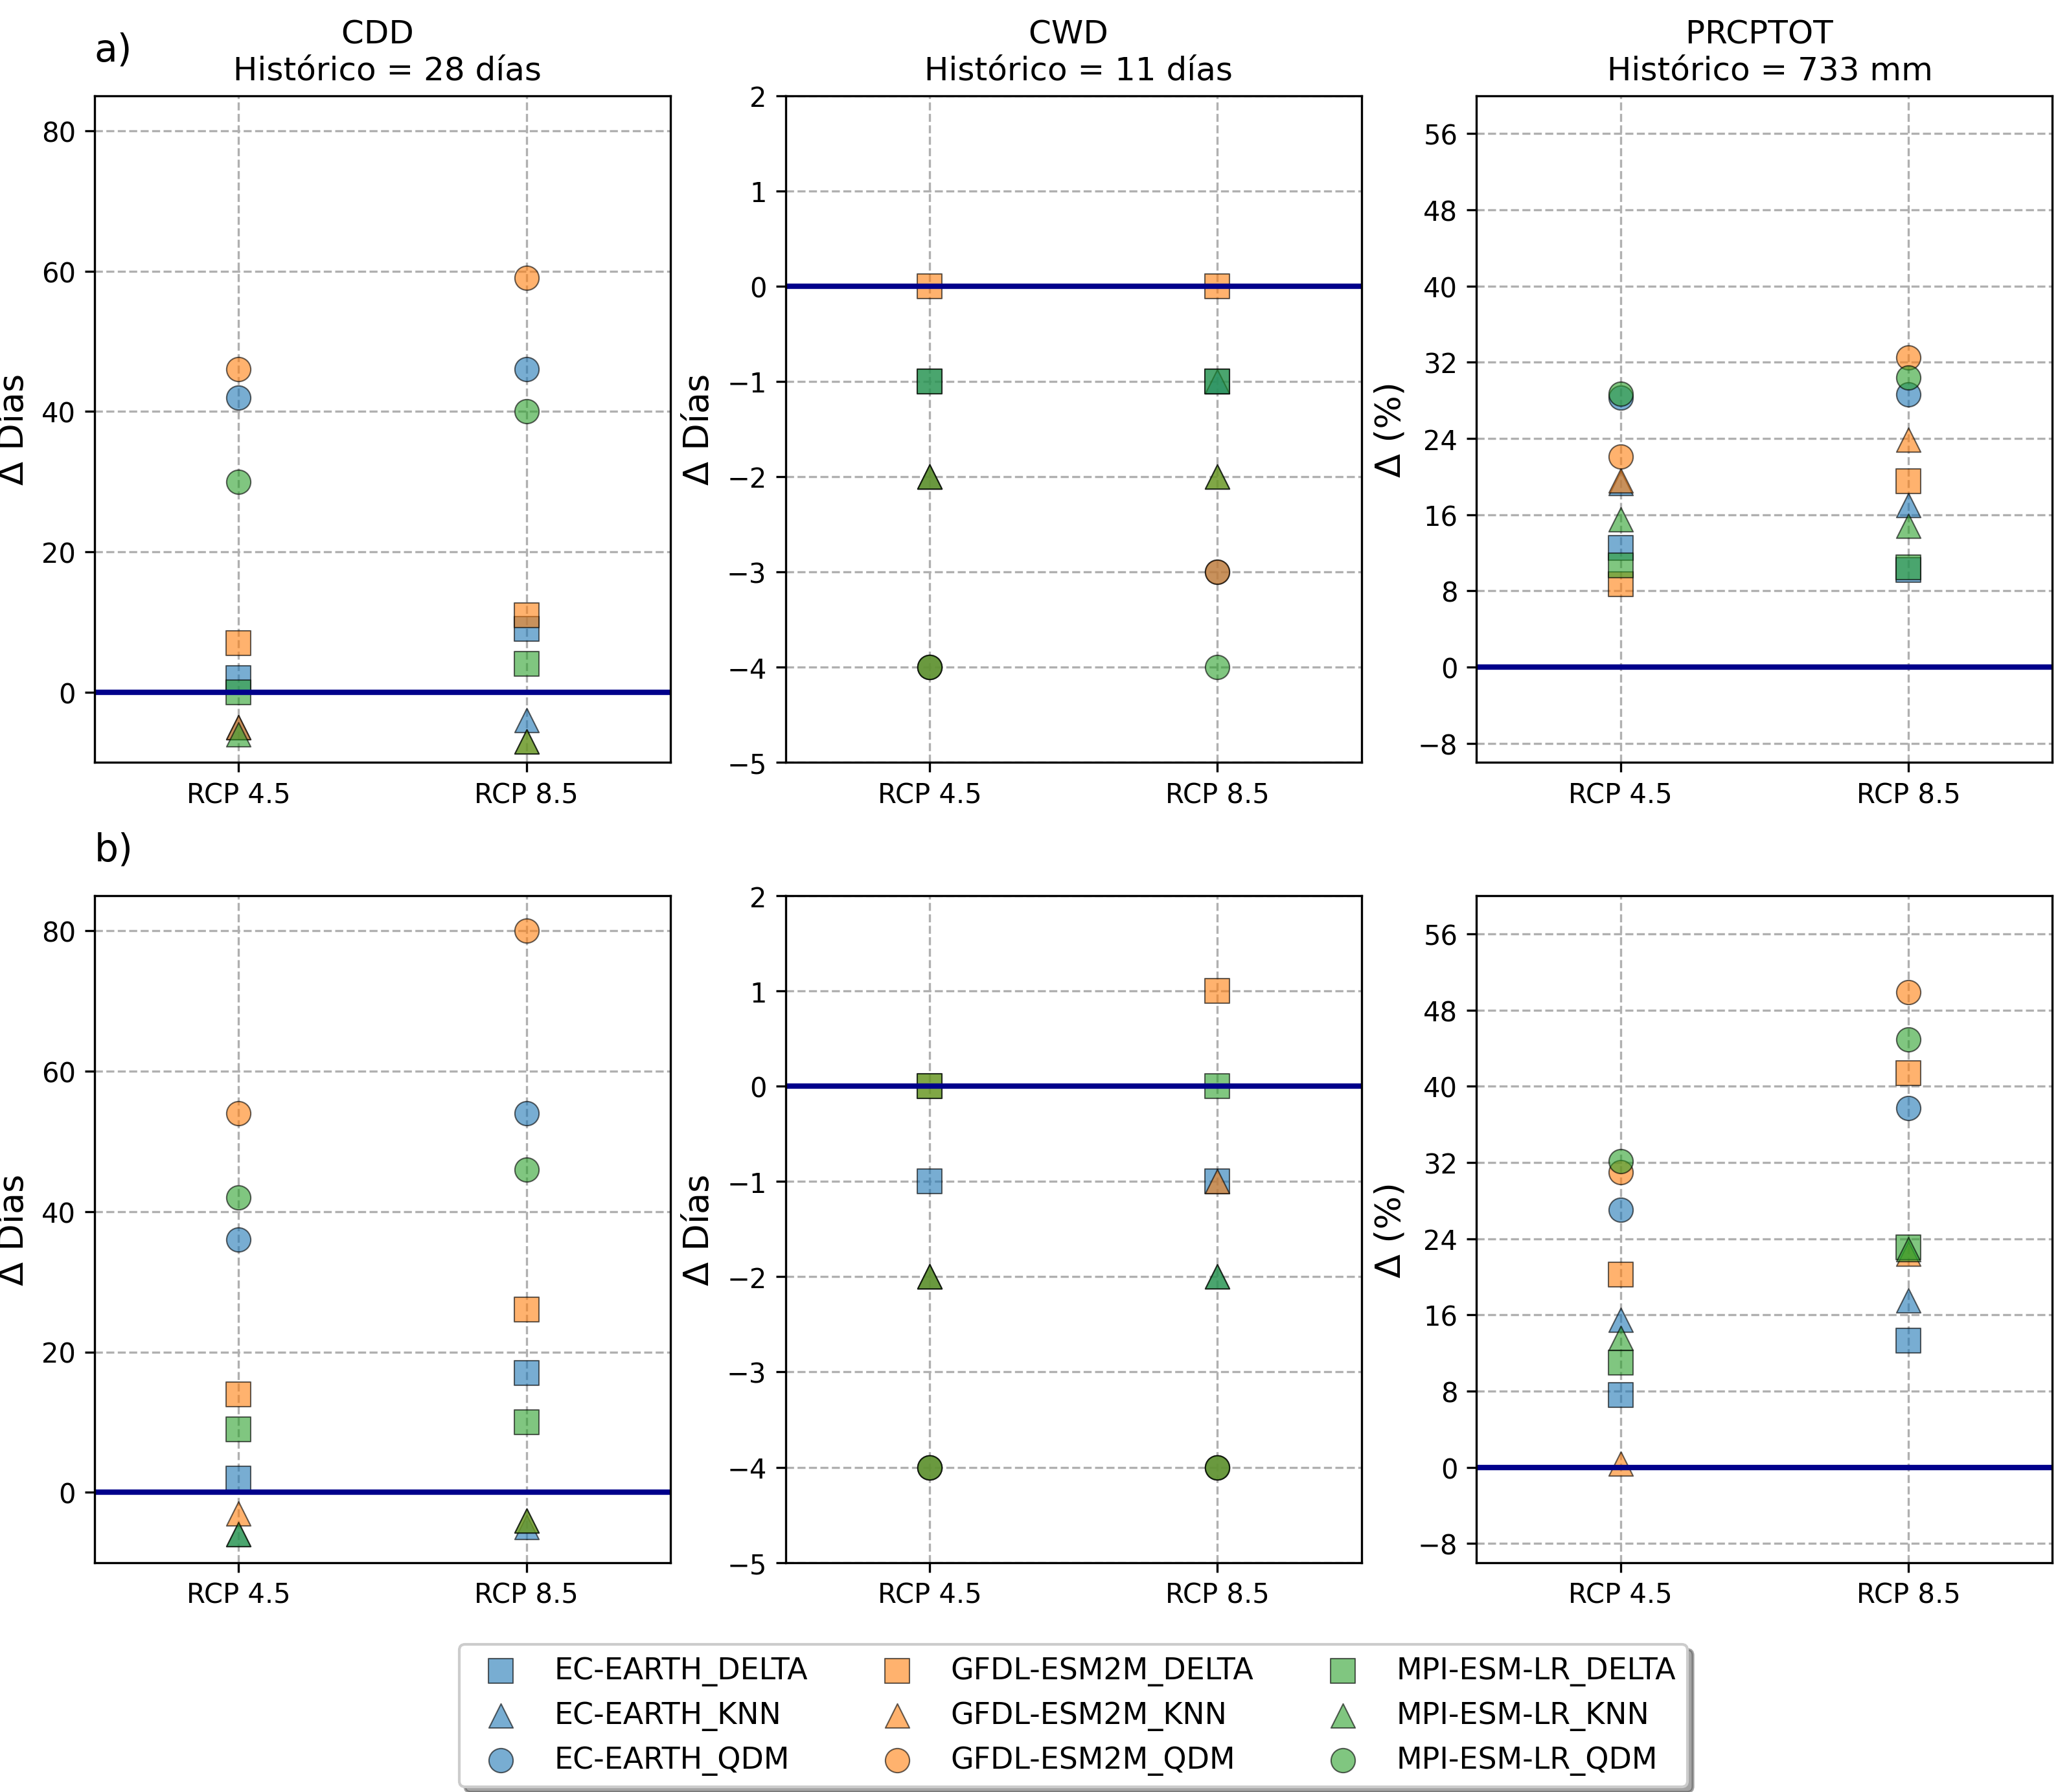
Made using Python, Matplotlib.
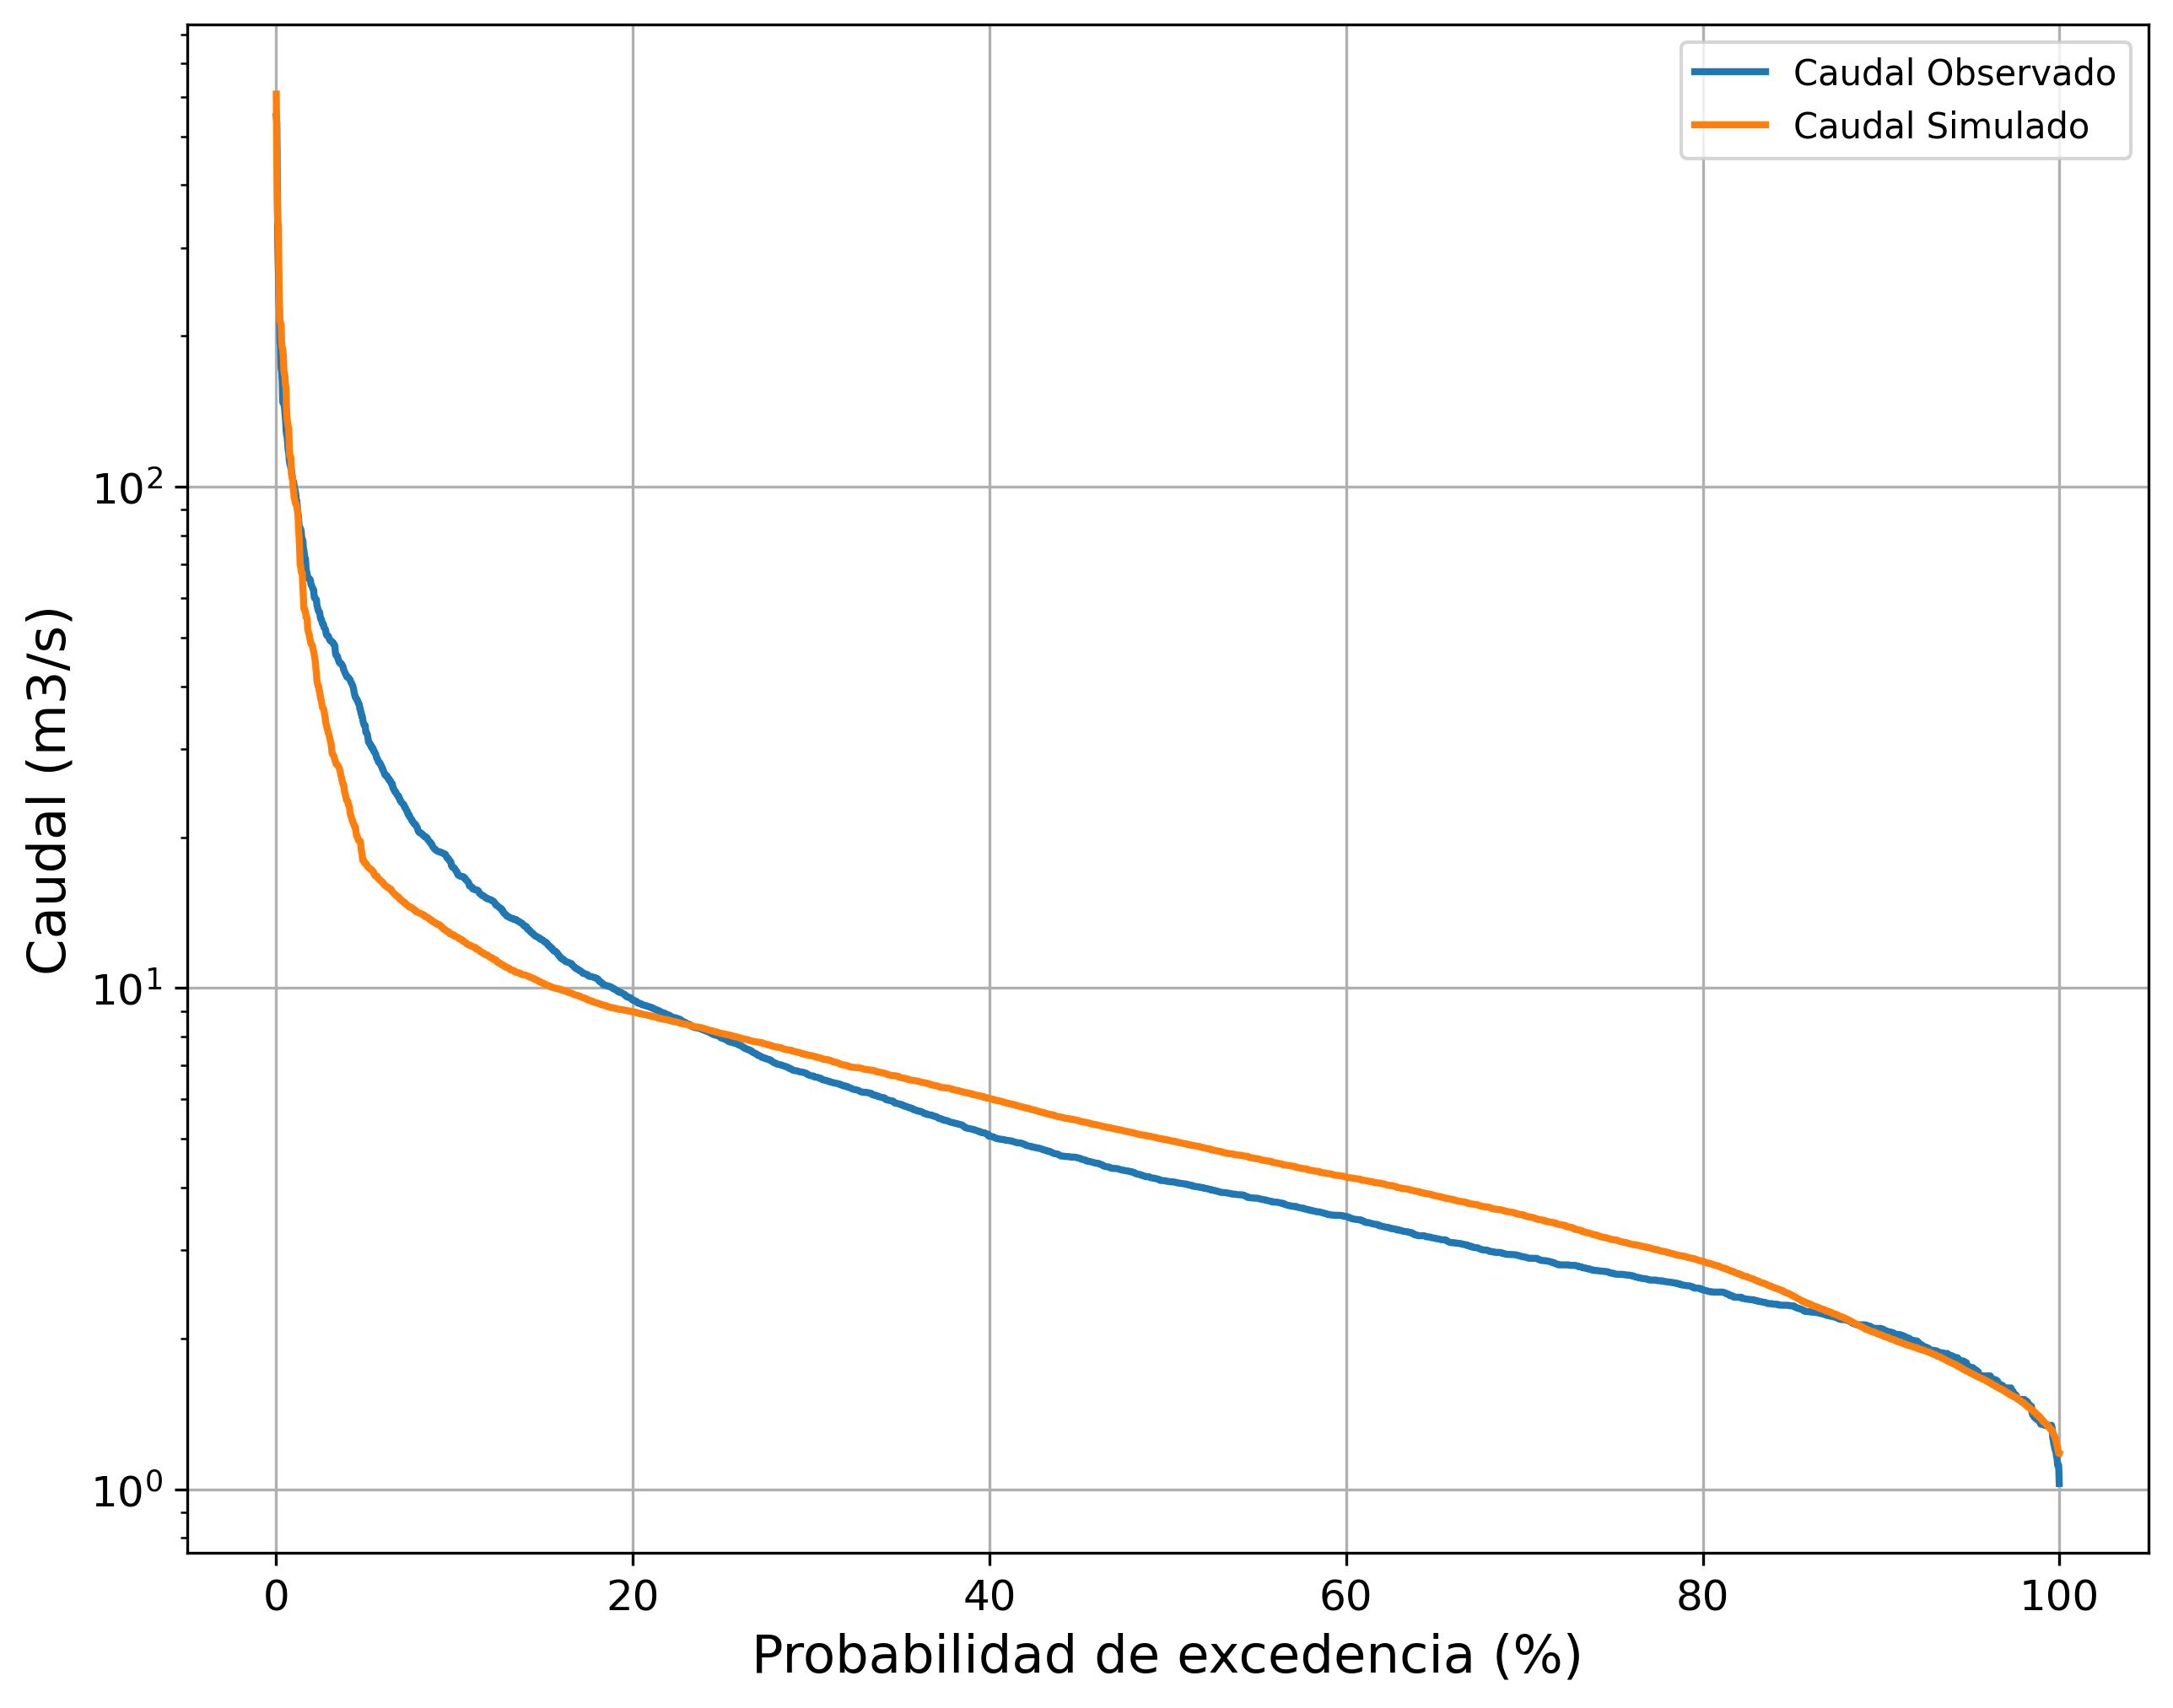
Made using HydroBID, Matplotlib.
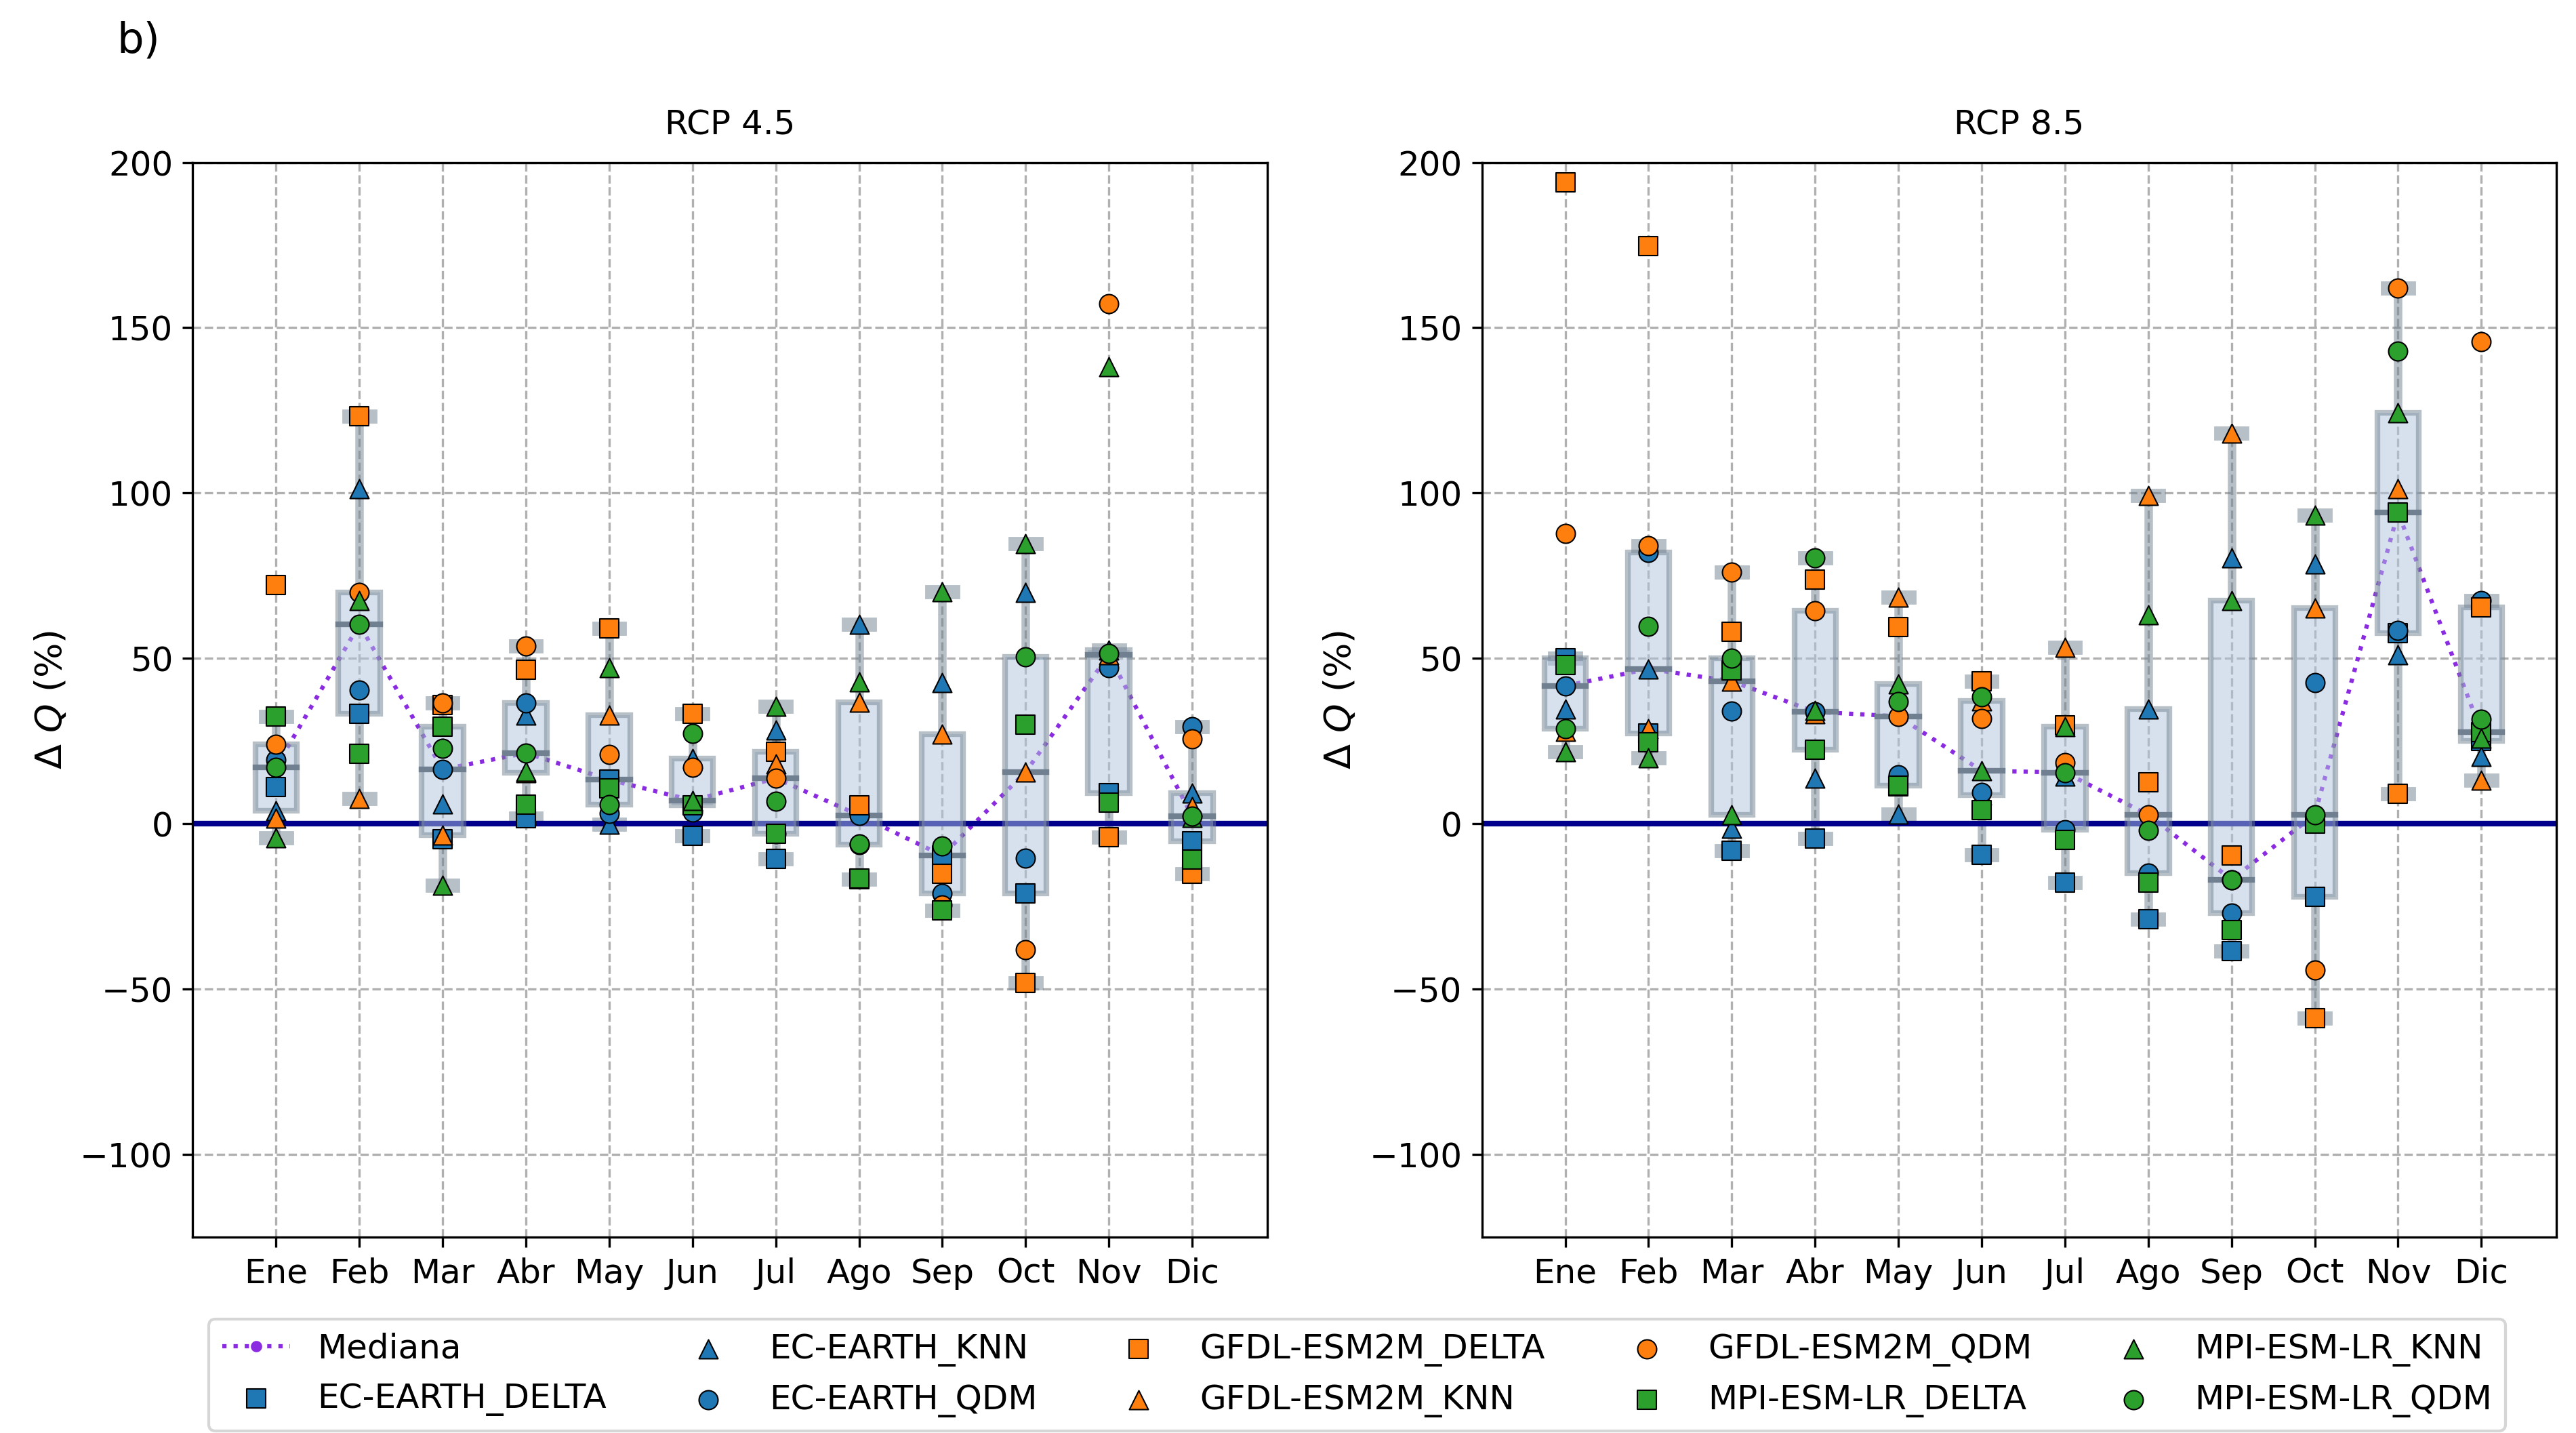
Made using HydroBID, Matplotlib.
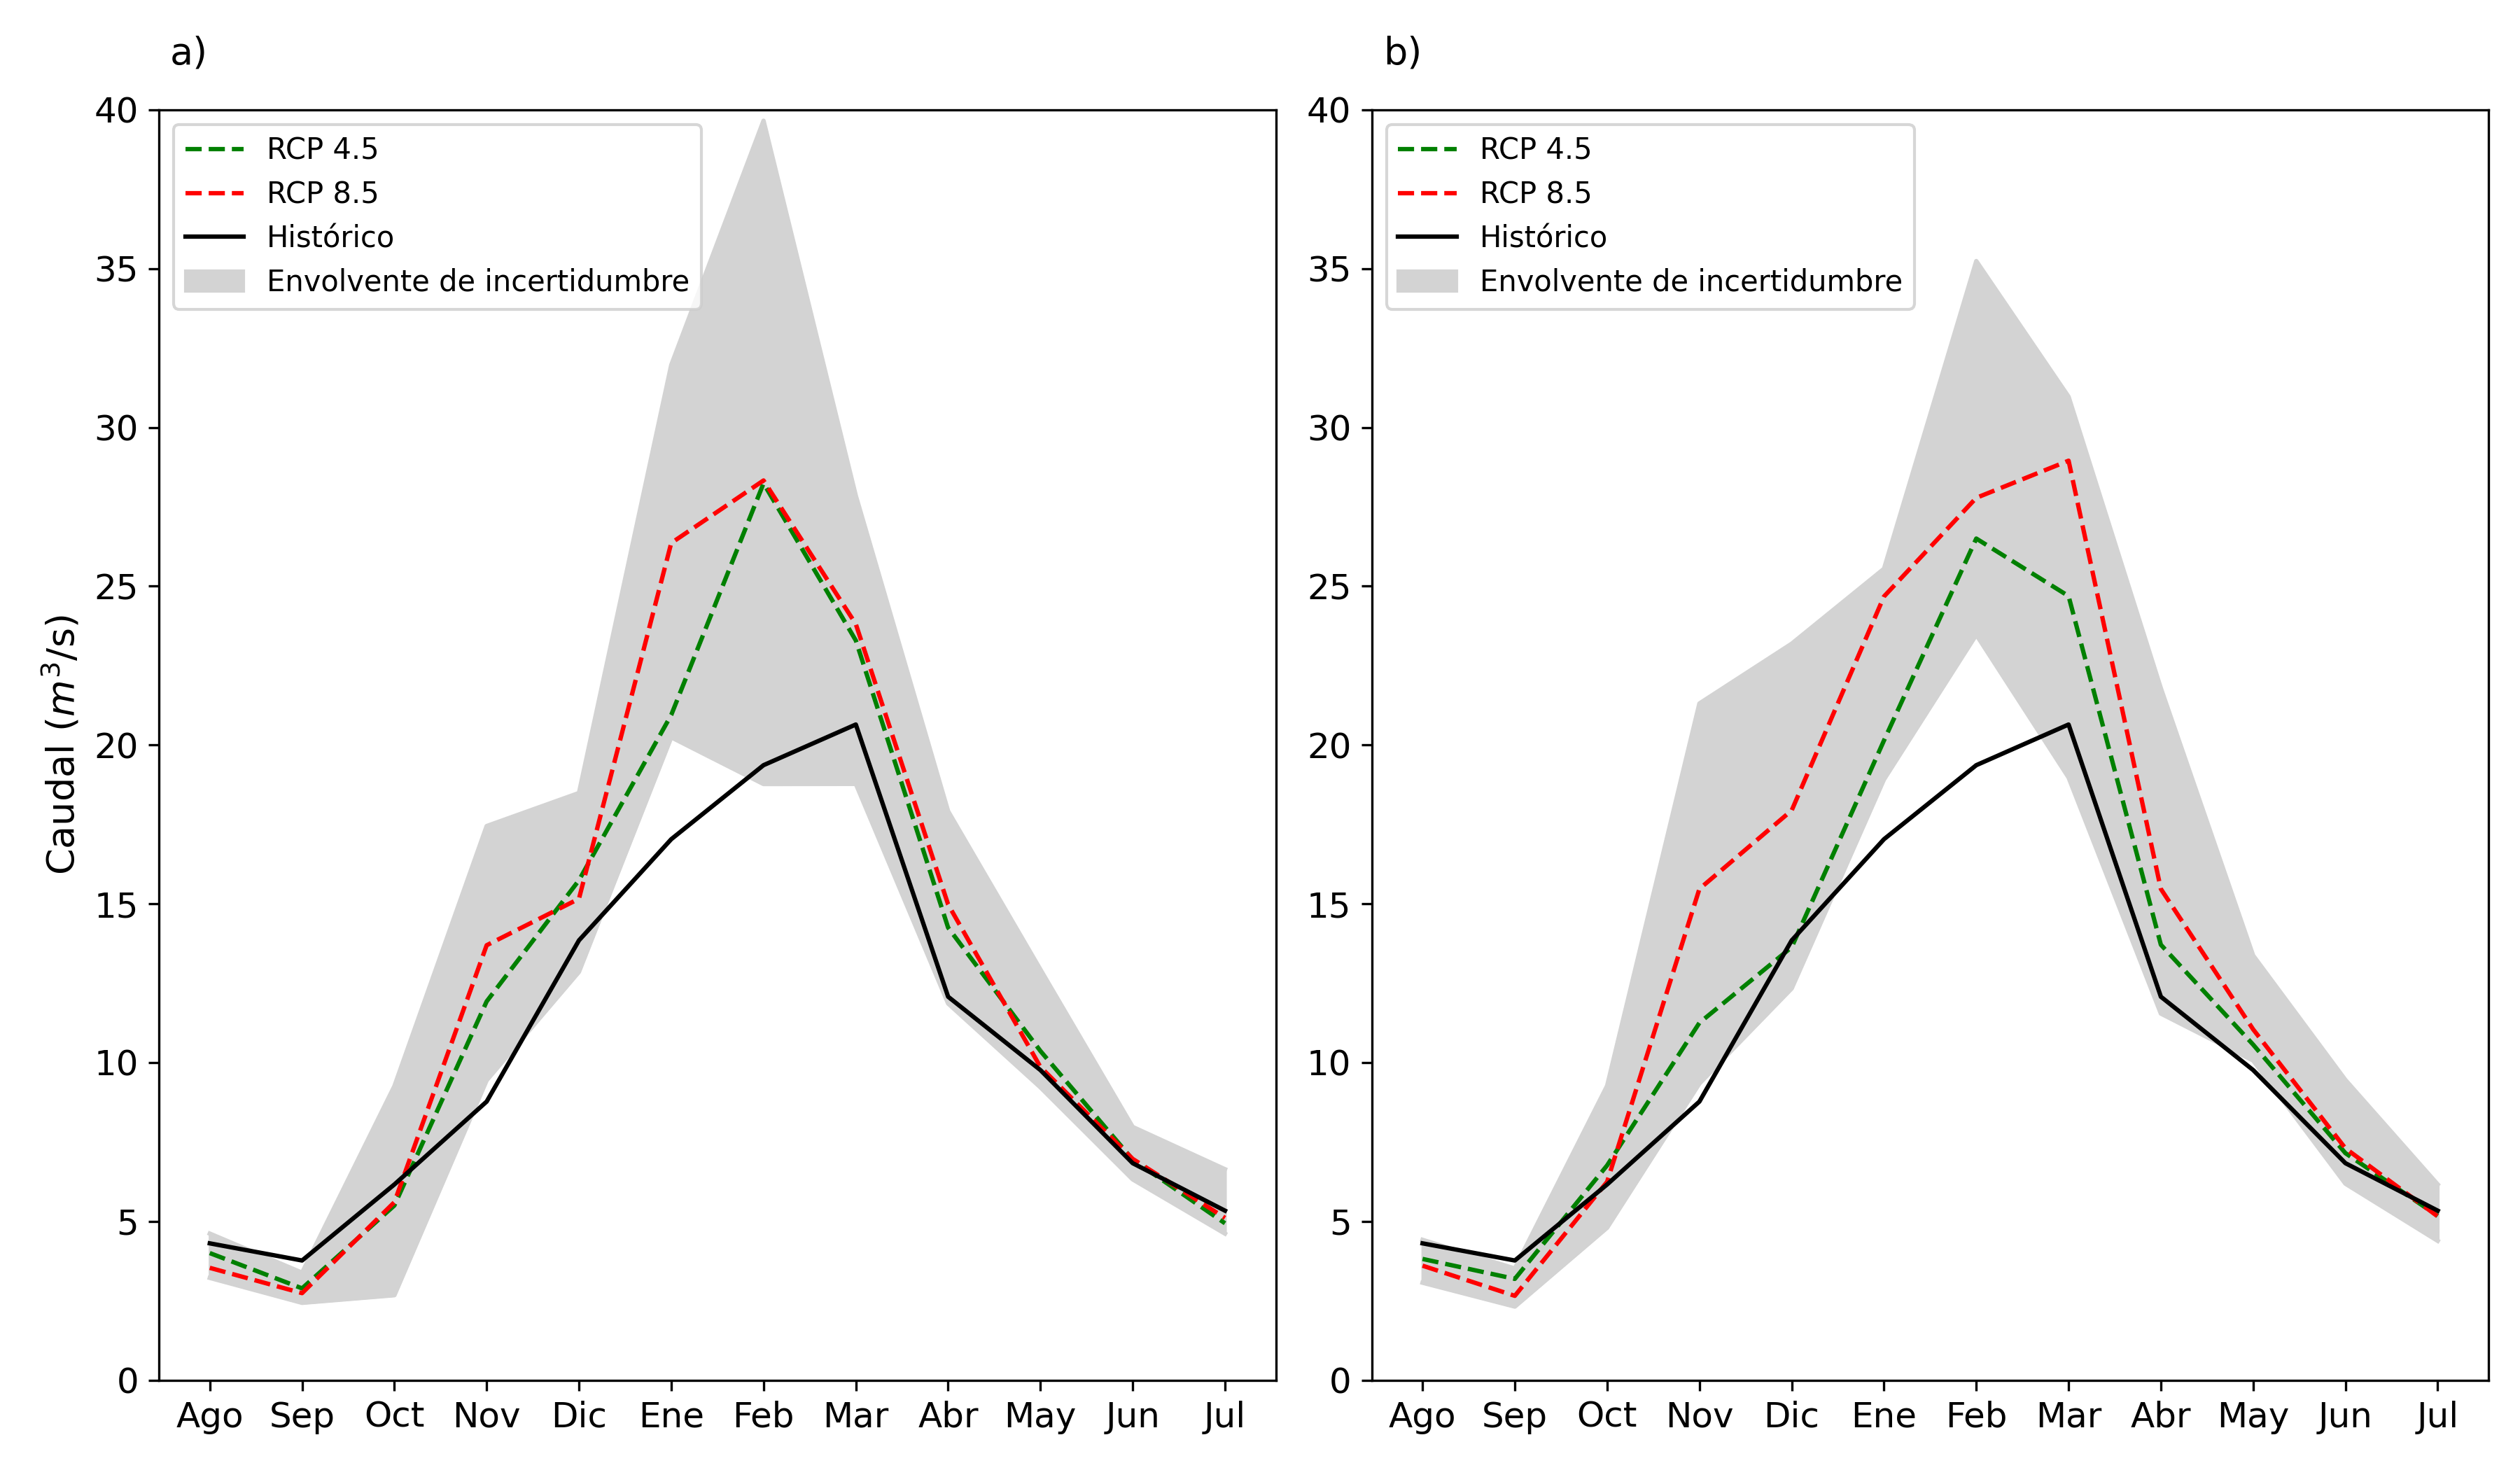
Made using HydroBID, Matplotlib.
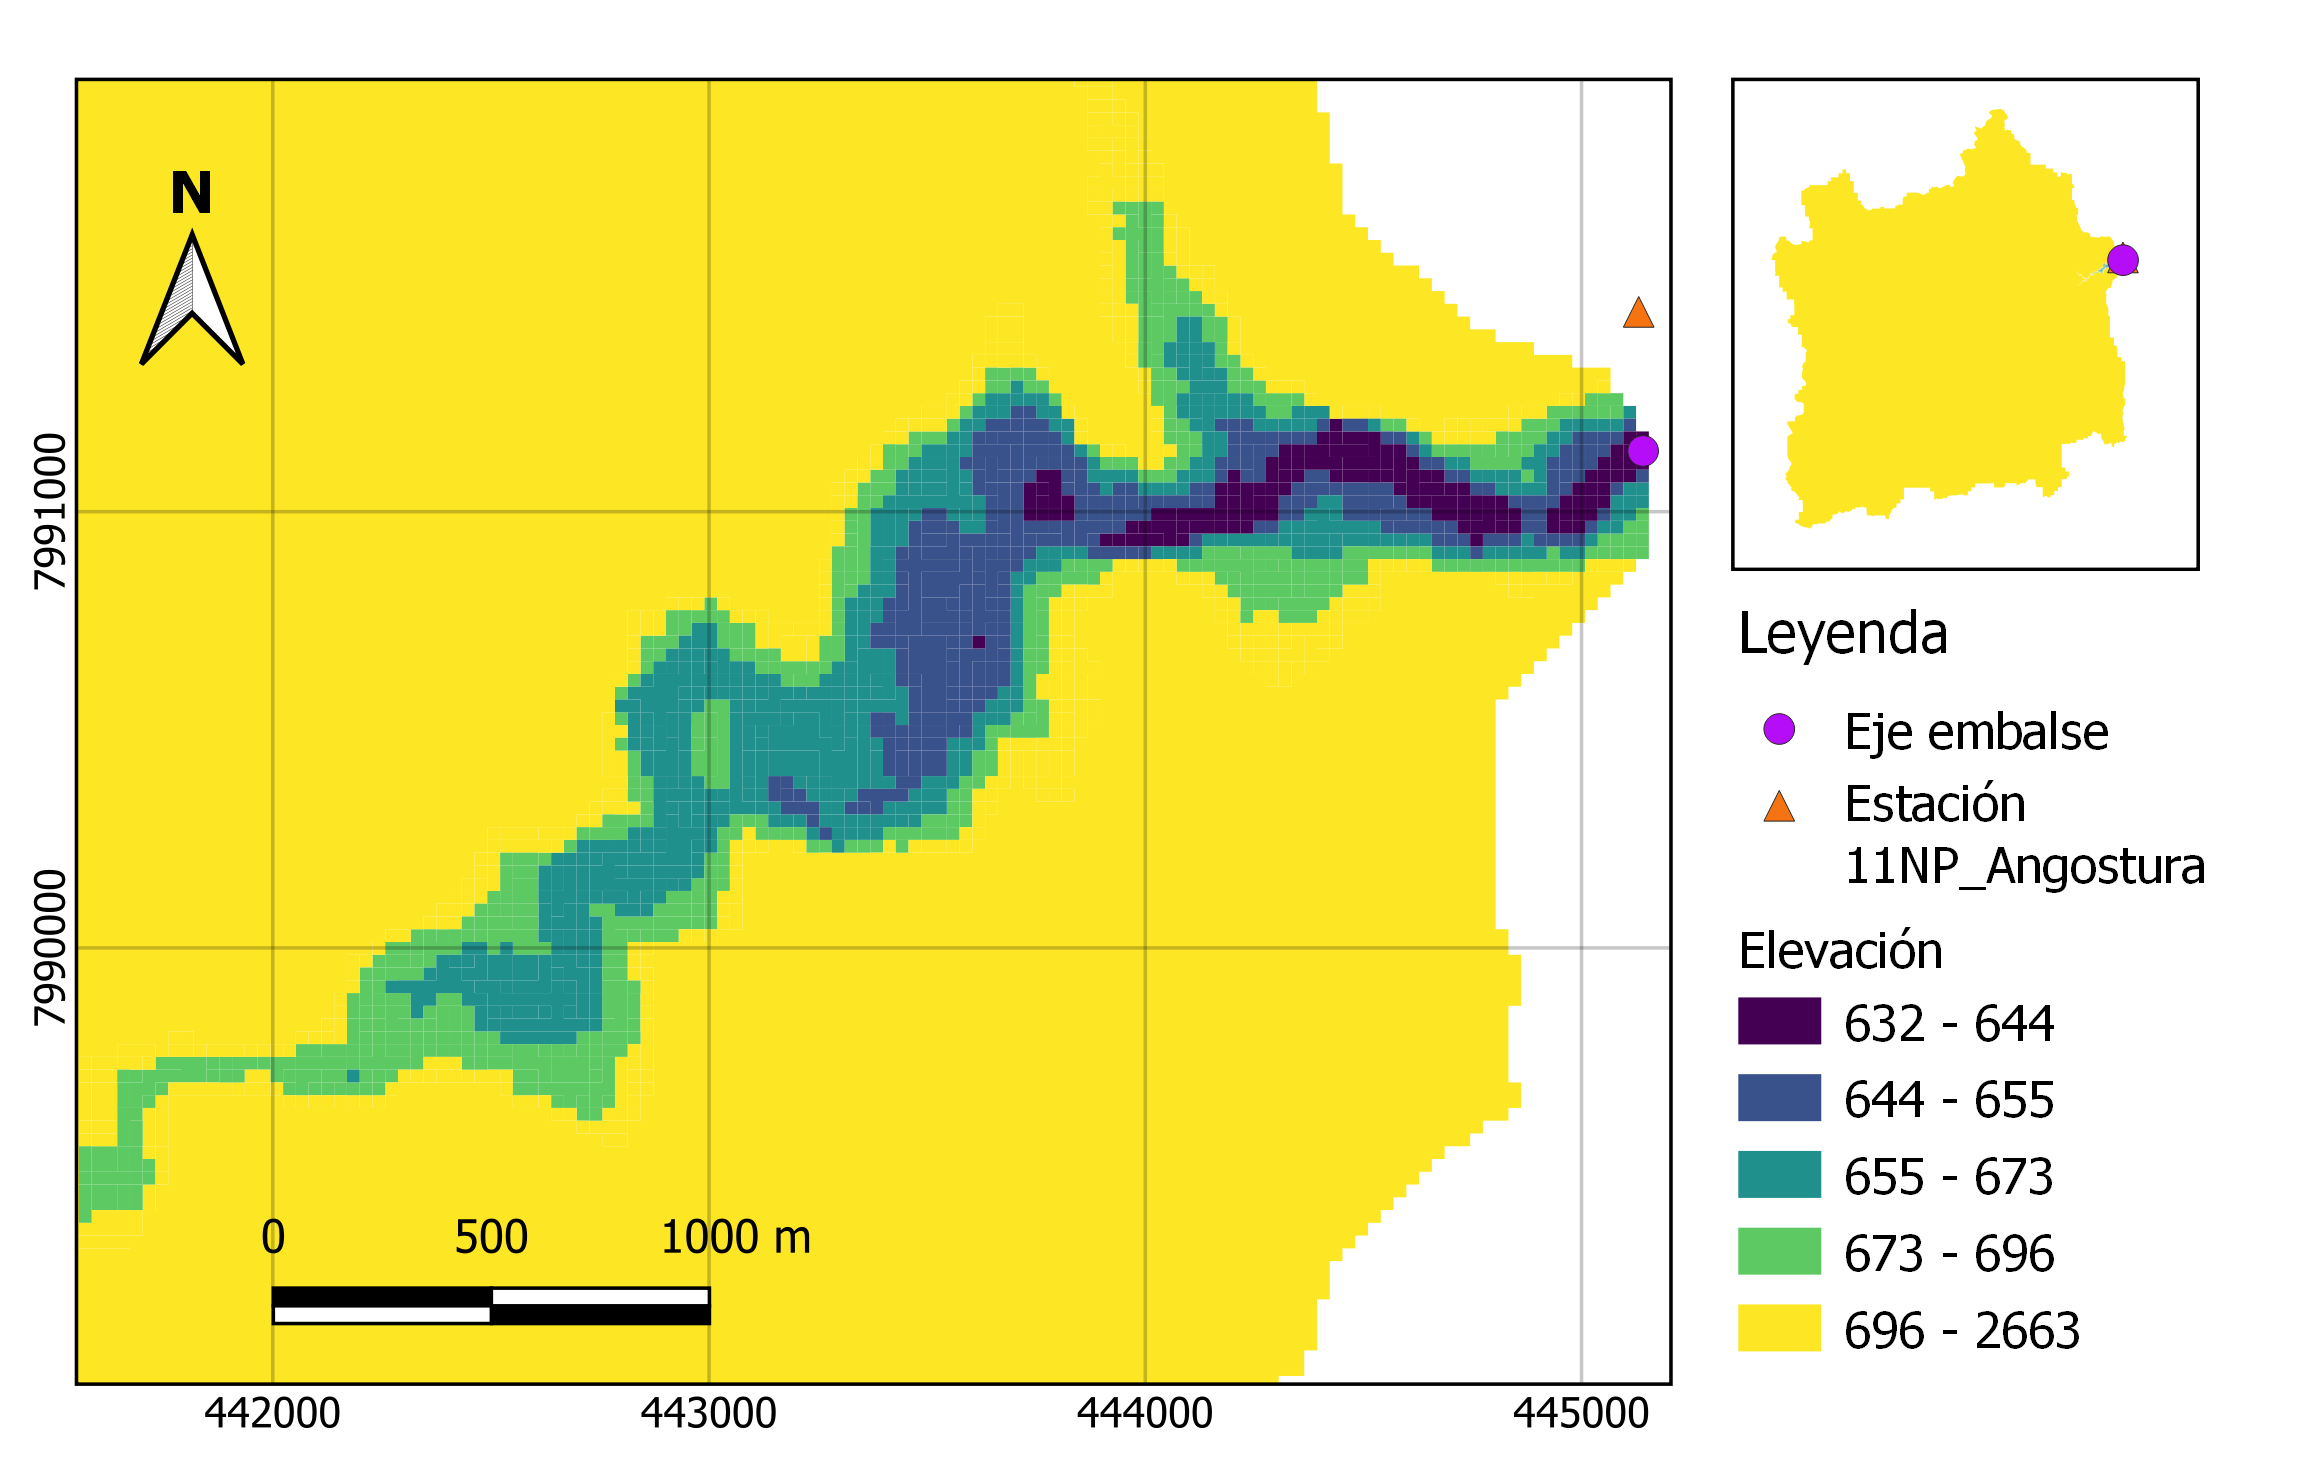
Made using QGIS.
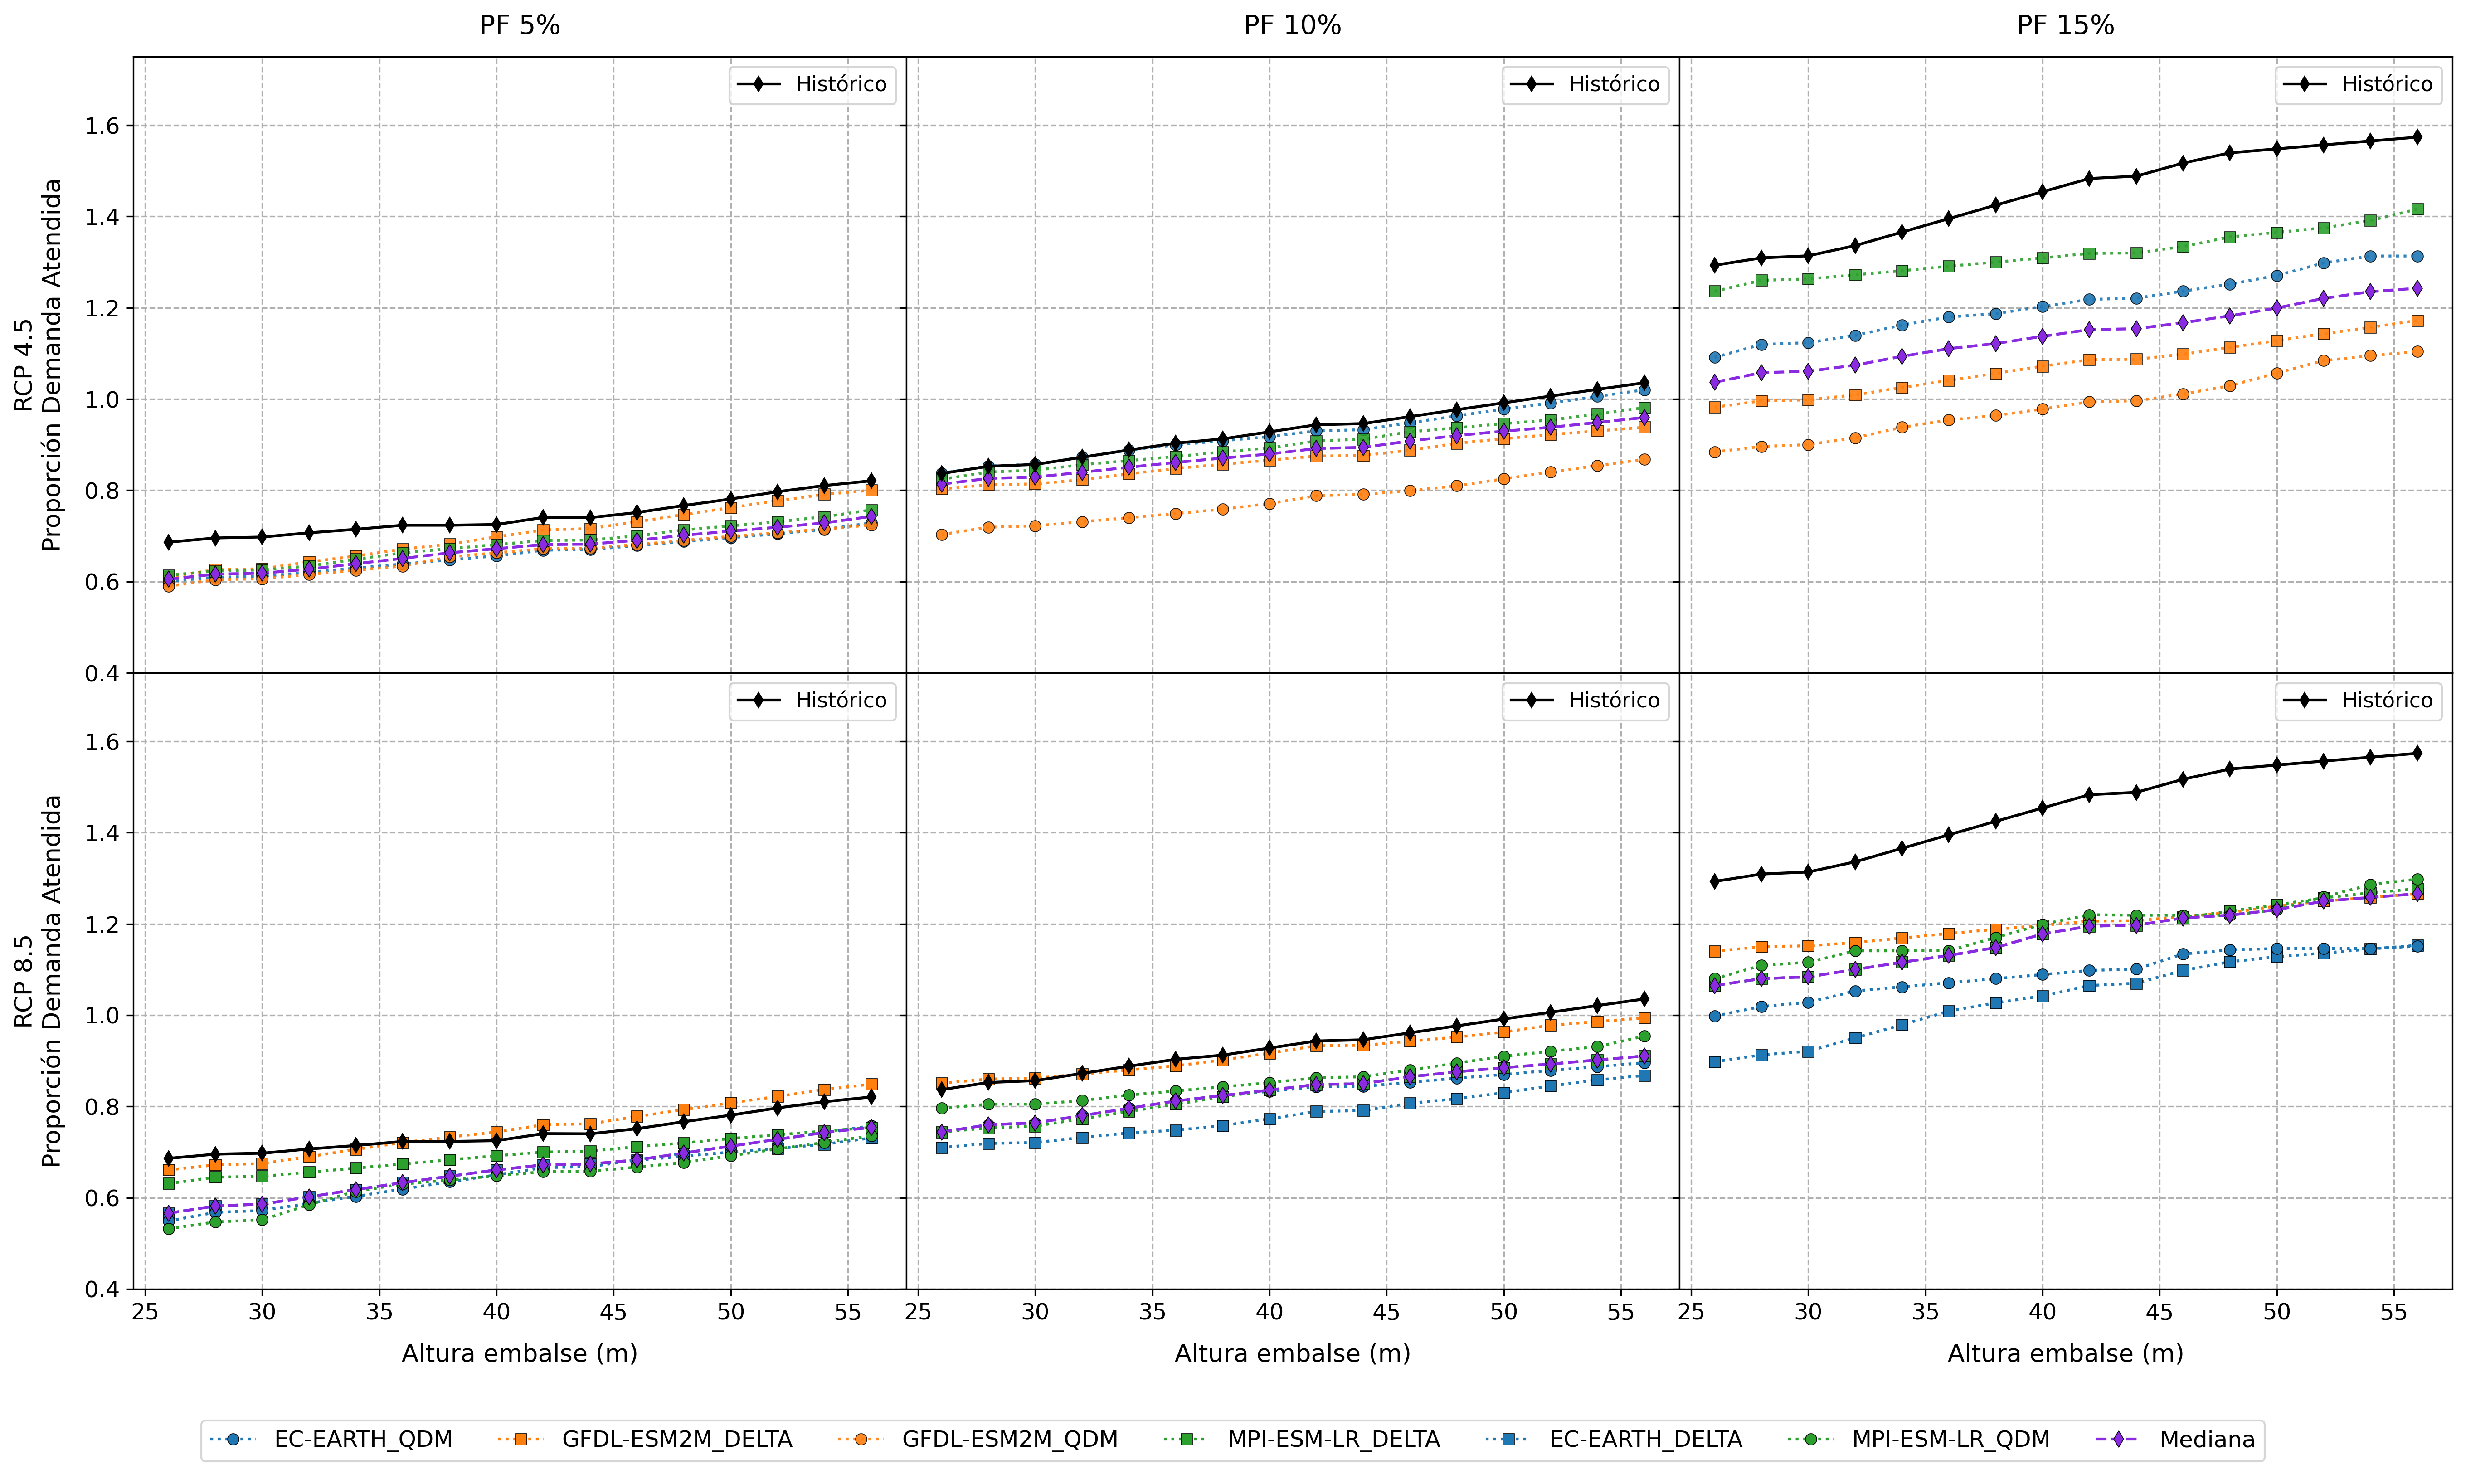
Made using Python, and Matplotlib.